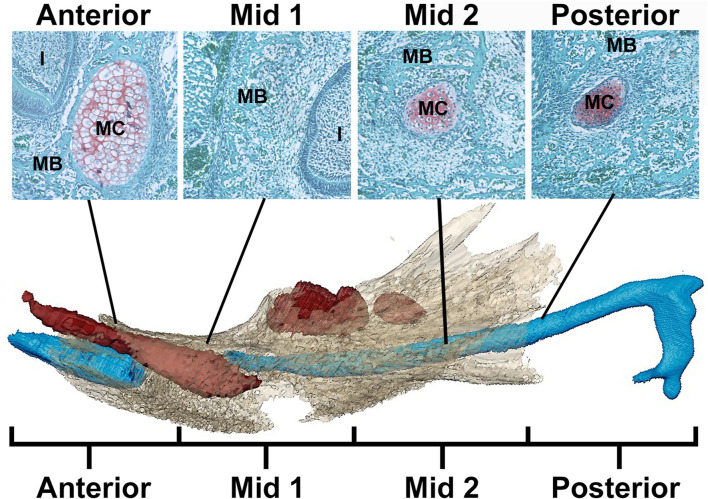
FIGURE 1.
Schematic of MC in mandible identifying regions for analysis. Example histological sections (top) associated with developing mandible and MC (bottom) (after Svandova et al., 2020). In the histological sections, mandibular bone matrix (MB) is stained green and is adjacent to the red-orange MC stained using a standard Safranin-O protocol. Below, the developing mandible (tan), segmented from microCT images, is superimposed with MC (blue) and mandibular teeth (red) segmented from PTA-enhanced microCT images of an E17.5 Fgfr2c +/+ embryo. Note that the color of MC and MB is not consistent between histological images (top) and 3D models created from PT-enhanced microCT images (bottom). MC is divided into 4 equal regions from anterior to posterior with Anterior and Mid 1 containing the break in MC at E17.5 associated with the root of the incisor (I). The incus is not included in this model.

