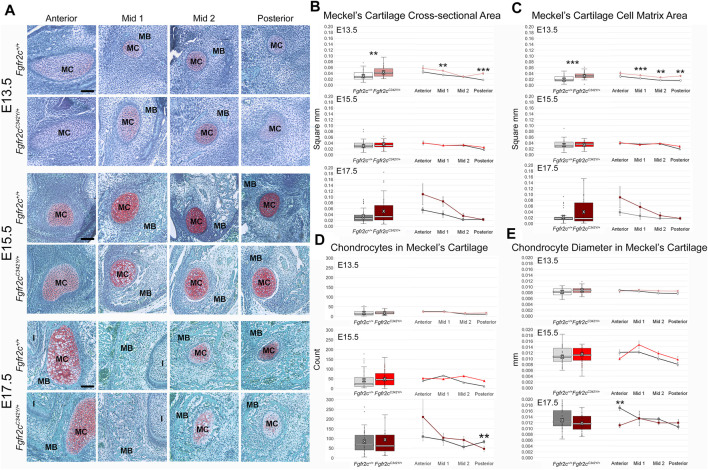
FIGURE 5.
Histomorphometric analysis of MC in Fgfr2c C342Y/+ embryos and Fgfr2c +/+ littermates, E13.5, E15.5, E17.5. (A) Representative Safranin O-stained sections of MC and surrounding mandible bone (MB) in the coronal plane from Fgfr2c +/+ and Fgfr2c C342Y/+ embryos at E13.5 (top two rows), E15.5 (middle two rows) and E17.5 (bottom two rows). Chondrocytes and matrix are identified by the red-orange Safranin O stain with green bone matrix surrounding (MB). The incisor (I) is adjacent to MC and MB in Anterior and Mid 1. Scale = 0.10 mm. (B) Assessment of cross-sectional area of MC indicates some differences by genotype early in development (E13.5, top) with Fgfr2c C342Y/+ embryos having a relatively greater area overall (box plot, left) and at specific regions in the antero-posterior dimension (line plots, right). (C) Similarly, more cartilage matrix was identified at E13.5 (top) in Fgfr2c C342Y/+ embryos with no differences by genotype being noted later in development [E15.5 (middle), E17.5 (bottom)]. (D) The number of chondrocytes within MC did not vary by genotype at either E13.5 (top) or E15.5 (middle), but fewer chondrocytes were counted in Posterior of Fgfr2c C342Y/+ embryos at E17.5 (bottom). (E) The average diameter of chondrocytes varied little from anterior to posterior aspects of MC and not at all by genotype at E13.5 (top) and E15.5 (middle). Chondrocytes in Anterior of E17.5 Fgfr2c C342Y/+ embryos were smaller than those in Fgfr2c +/+ embryos (bottom two rows). White bar in box plot identifies median. X in box plot identifies mean. n = 3 individuals per genotype per age with at least 4 images per region per embryo being analyzed. **p ≤ 0.01, ***p ≤ 0.001.

