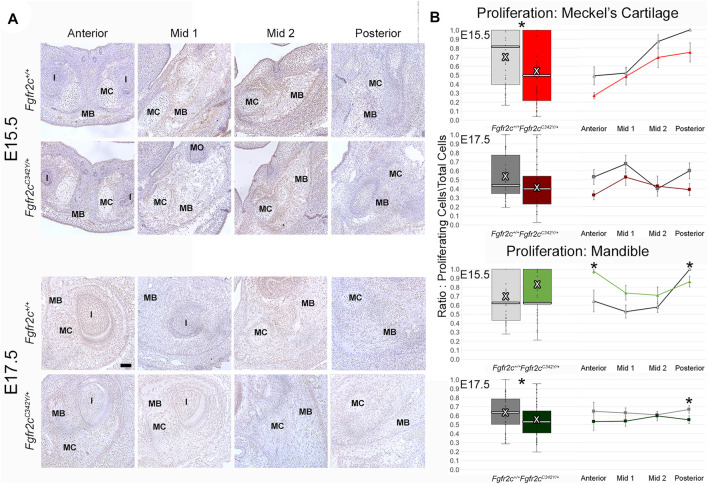
FIGURE 6.
Effect of Fgfr2c C342Y mutation on proliferation in and around MC in E15.5 and E17.5 embryos. (A) Representative coronal sections of MC and surrounding mandible bone (MB) in Fgfr2c +/+ and Fgfr2c C342Y/+ embryos stained with Proliferating Cell Nuclear Antigen (PCNA, brown stain) counterstained with hematoxylin (purple) at E15.5 (top rows) and E17.5 (bottom rows). Scale = 0.1 mm. Note that due to variation in the location of the natural break in MC, only a small remnant of MC remains in Mid 1 at E17.5 in the displayed image of an Fgfr2c +/+ embryo. (B) Quantification of proliferating cells in MC (top 2 rows) and mandible (bottom 2 rows) standardized by the total number of cells within each region. Proliferation was reduced in MC of Fgfr2c C342Y/+ embryos at E15.5 and in mandible of Fgfr2c C342Y/+ embryos at E17.5. White bar in box plot identifies median. X in box plot identifies mean. n = 3 individuals per age per genotype with at least 4 images per region per embryo being analyzed. *p ≤ 0.05. I = incisor; MO = molar.

