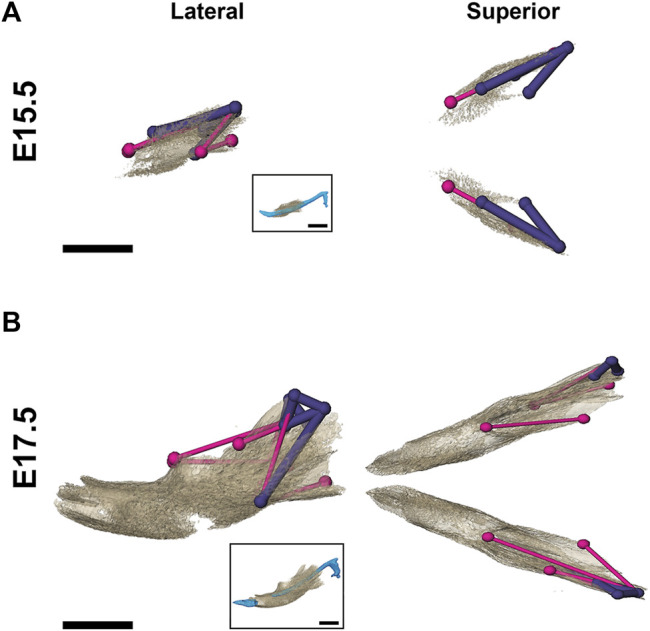
FIGURE 7.

Morphological differences in Fgfr2c C342Y/+ and Fgfr2c +/+ mandibular bone at E15.5 and E17.5. Results of EDMA using 3D landmark coordinates of 14 anatomical landmarks at E15.5 (A) and 20 anatomical landmarks at E17.5 (B) show linear distances within each model that are significantly smaller by at least 5% between genotypes. Lateral views (buccal) at left and superior views at right. Thin pink lines indicate linear distances that are decreased by 5%–10% in Fgfr2c C342Y/+ embryos, and thick purple lines indicate linear distances that are reduced by 10%–23% in Fgfr2c C342Y/+ embryos. For orientation, superimpositions of MC and mandibular bone are inset. Scalebar = 1.0 mm.
