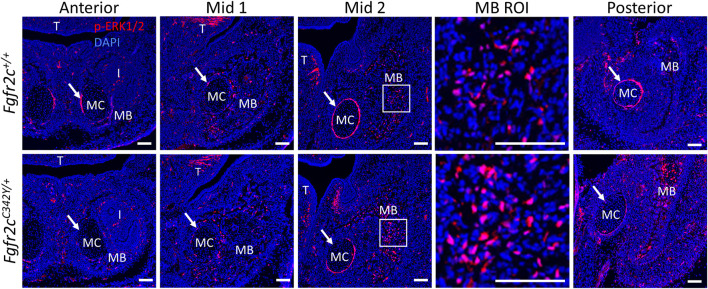
FIGURE 9.
ERK pathway activation in the lower jaw of Fgfr2c +/+ and Fgfr2c C342Y/+ embryos at E15.5. Immunofluorescence for p-ERK1/2 in coronal sections of Fgfr2c +/+ (top) and Fgfr2c C342Y/+ (bottom) embryos at E15.5. Anterior, Mid 1, Mid 2, and Posterior indicate the regions of the lower jaw identified in Figure 1. Images in MB ROI column show higher magnification of the boxed areas in Mid 2. Arrows mark the locations of the perichondrium of MC. I, incisor; MB, mandible; MC, Meckel’s cartilage; T, tongue. n = 3 per genotype with at least 4 images per individual being analyzed. Scale = 100 µm.

