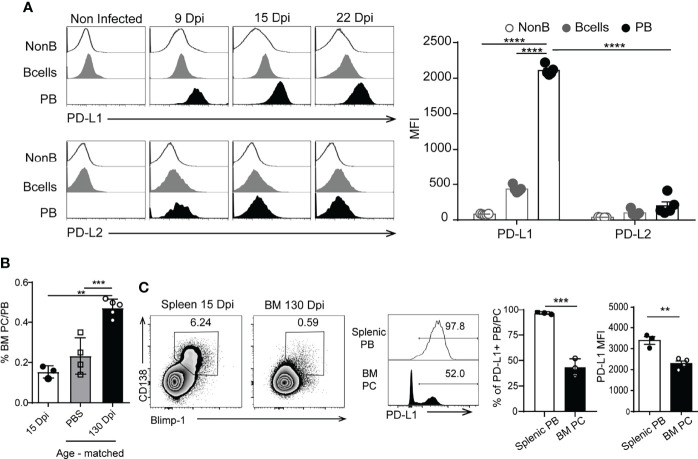
Figure 2.
Plasmablasts from T. cruzi-infected mice expressed high levels of PD-L1. (A) Representative histograms of PD-L1 or PD-L2 expression on splenic non-B cells (CD19-CD138-B220-), B cells (CD19+CD3-CD138-B220+) from non-infected mice (n=5) and T. cruzi-infected C57BL/6 mice (n=5) and on plasmablasts (PB) (CD19intB220lowCD138hi) from T. cruzi-infected C57BL/6 mice evaluated at 9, 15 and 22 Dpi. Statistical analysis of mean fluorescence intensity (MFI) of PD-L1 or PD-L2 on the mentioned cells analyzed at 15 Dpi. ****p < 0.0001 one-way ANOVA, Bonferroni post hoc test. (B) Statistical analysis of the frequency of PB/PC (plasma cell) CD138+Blimp-1+ of live single lymphocytes (gated on IgD-IgM-CD11b-CD24-) from bone marrow (BM) obtained at 15 Dpi (white bar) and at 130 Dpi with T. cruzi (black bar). Cells from BM from age-matched non-infected mice, injected with PBS, were used as controls (gray bar). (C) Representative plots of CD138 vs Blimp-1 of live single lymphocytes (gated on IgD-IgM-CD11b-CD24-) from spleen and bone marrow (BM) obtained at 15 Dpi and 130 Dpi with T. cruzi, respectively. Representative histograms of PD-L1 on gated CD138+Blimp-1+B220+ cells. Numbers in histograms indicate the percentage of PD-L1+ cells. Bar graph shows statistical analysis of the frequency of PD-L1+ PB/PC and MFI of PD-L1+ on splenic PB from 15 Dpi-Tcruzi infected mice (white bar) and 130 Dpi-BM plasma cells (PC). **p < 0.01, one-way ANOVA, Bonferroni post hoc test. Data in (A, B) are representative of three independent experiments. ***p < 0.001.

