
Figure 2.
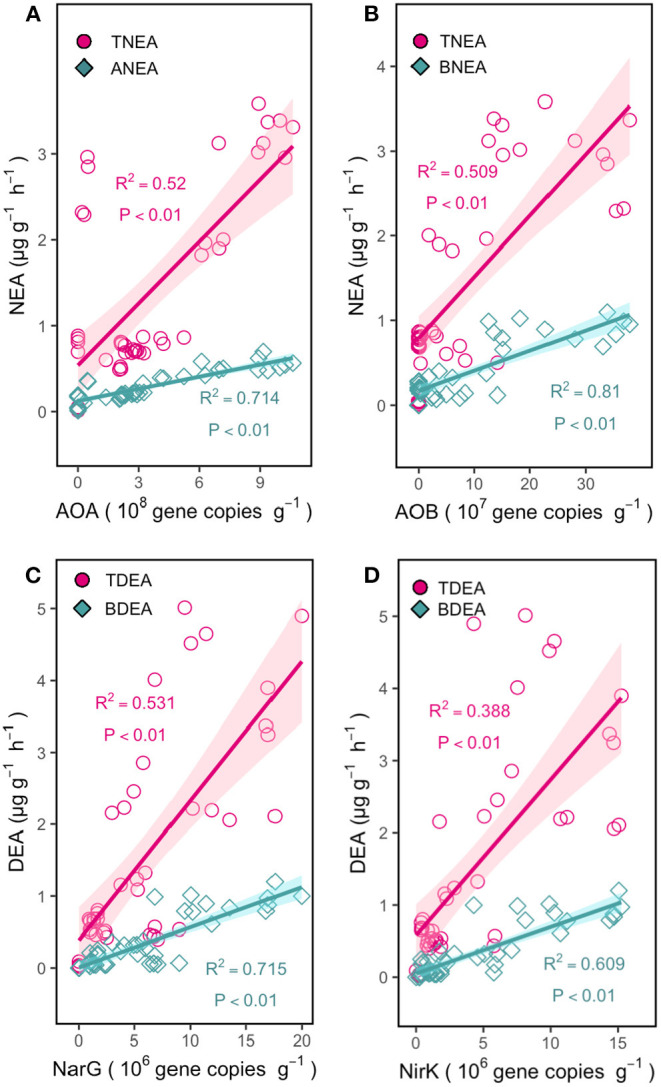
Relationships between the abundance of AOA and TNEA or ANEA (A); AOB and TNEA or BNEA (B); narG and TDEA or BDEA (C); nirK and TDEA or BDEA (D) in grassland soils. The R2 values are the coefficients of determination.
Official websites use .gov
A
.gov website belongs to an official
government organization in the United States.
Secure .gov websites use HTTPS
A lock (
) or https:// means you've safely
connected to the .gov website. Share sensitive
information only on official, secure websites.
Relationships between the abundance of AOA and TNEA or ANEA (A); AOB and TNEA or BNEA (B); narG and TDEA or BDEA (C); nirK and TDEA or BDEA (D) in grassland soils. The R2 values are the coefficients of determination.