Figure 3.
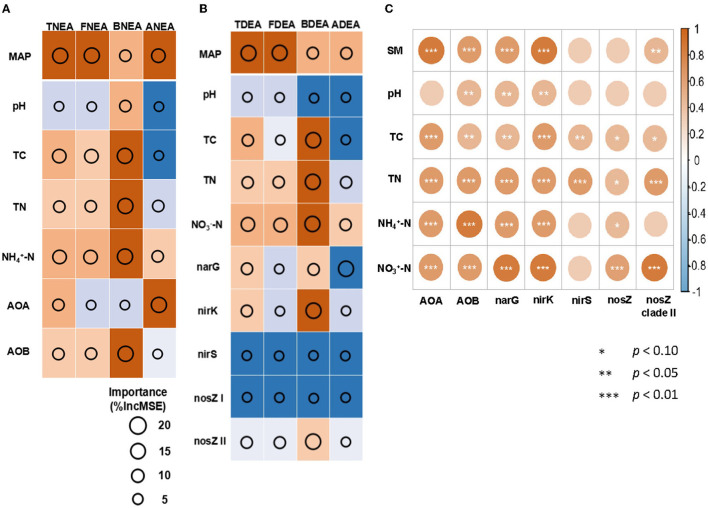
Random forest (RF) models to identify the significant environmental factors and the abundance of nitrification genes controlling TNEA, FNEA, BENA, and ANEA (A); the abundance of denitrification genes controlling TDEA, FDEA, BDEA, and ADEA (B). The relationships between the physical and chemical properties of the soil and gene abundance (C). The importance is calculated as the percentage (%) increase in the mean square error in RF models (%IncMSE). For (A,B), the size of the circles indicates the importance of the environmental factors or the gene abundance for TNEA and TDEA. The text colored in orange represents adjusted p < 0.05; in blue represents adjusted p > 0.05, with the darker color indicating the lower or higher p-value, respectively. For (C), the color shade indicated the coefficients of determination, * indicates p < 0.10, ** indicates p < 0.05, and *** indicates p < 0.01.

