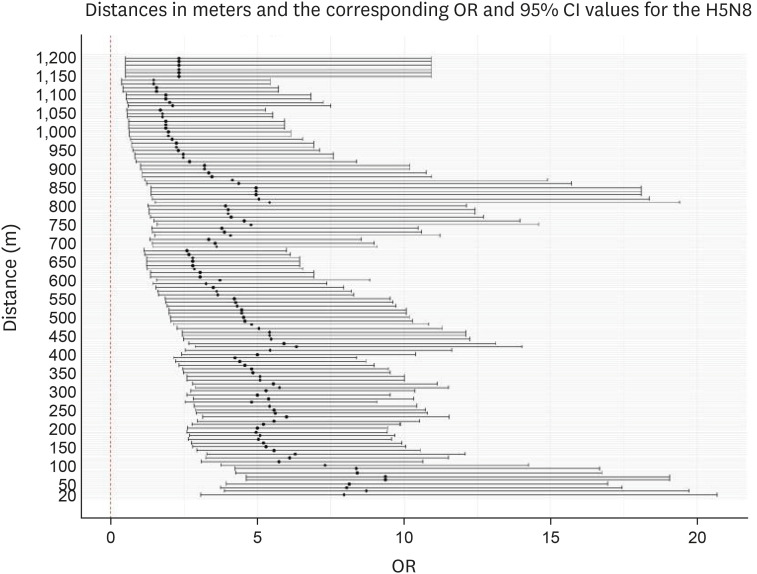
Fig. 7. Forest plot showing ORs as black dots with corresponding 95% CI values as lines, as per conditional logistic regression analysis for the 2014–2016 avian influenza outbreak. Neighboring inland water bodies at each distance from the poultry farm were evaluated using R software.
OR, odds ratio; CI, confidence interval.

