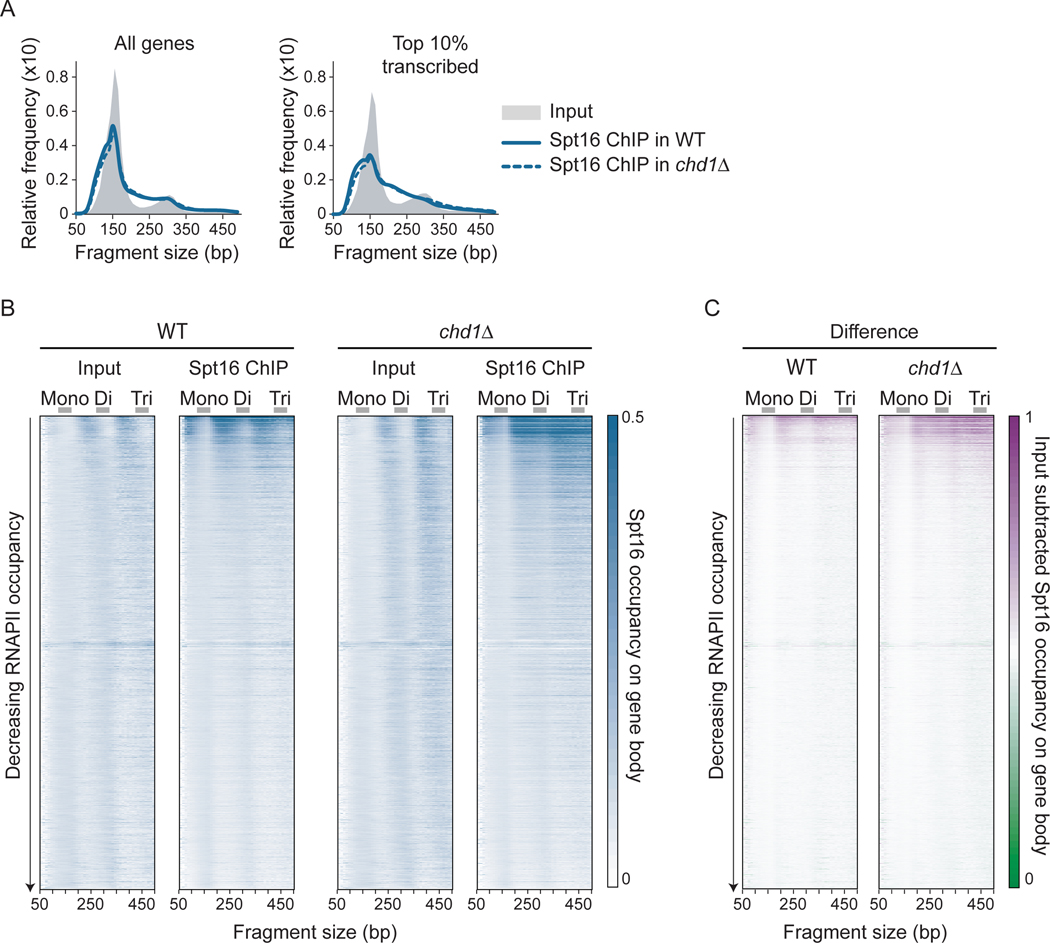
Figure 4:
FACT binds disorganized nucleosomal particles on transcribed genes. A) Distribution plots of the size of DNA fragments recovered from Input and FACT (Spt16) MNase-ChIP-seq samples from WT and chd1Δ cells for all (n = 5,796) and the top 10% transcribed (n = 580) genes. B-C) Heatmaps representation of Input and Spt16 average occupancy (rpm) (B) and of Input-subtracted Spt16 average occupancy (rpm) (C) on gene body (n = 5,796, sorted by decreasing RNAPII occupancy on the y-axis) from WT and chd1Δ cells, as determined by MNase-ChIP-seq, computed with DNA fragments from different sizes (x-axis). Mono-, di- and tri-nucleosome-sized DNA fragments are indicated. See also Figure S4.

