Figure 7:
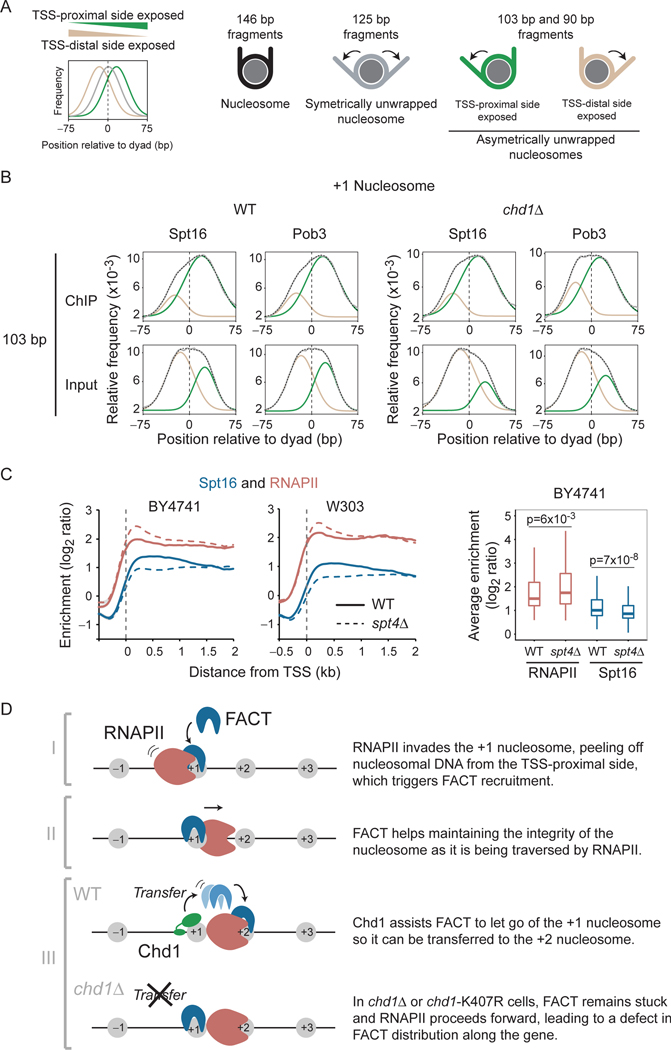
FACT recognizes +1 nucleosomes, asymmetrically unwrapped from their TSS-proximal side. A) Graphical explanation for the interpretation of the distribution plots shown in panel B. The graphs show the distribution of the center of subnucleosomal size fragments. A distribution centered at “0” (grey trace) indicates symmetrically unwrapped nucleosomal particles, whereas a distribution centered to the left (tan) or the right (green) indicates nucleosomal particles asymmetrically unwrapped on their TSSdistal and TSS-proximal side, respectively. We used 90 bp, 103 bp, and 125 bp fragments as per (Ramachandran et al., 2017). B) Distribution of 103 bp (+/− 5 bp) fragment centers, from FACT (Spt16 and Pob3) MNase-ChIP-seq experiments (and their Inputs) from WT and chd1Δ cells, plotted relative to the position of +1 nucleosome dyads on all genes (n = 5,796). The data (grey) were fitted to a doubleGaussian (dotted). The tan and green traces show the two individual Gaussians representing asymmetrically unwrapped on their TSS-distal and TSS-proximal side, respectively as depicted in panel A. C) Full recruitment of FACT requires Spt4/Spt5. Left: Metagene of Spt16 and RNAPII (Rpb3) occupancy over transcribed genes, as determined by ChIP-chip, relative to Input, in WT and spt4Δ cells. Data are shown for experiments performed in two genetic backgrounds (BY4741, n = 275 and W303, n = 295). Right: A box plot of the average RNAPII and Spt16 occupancy in WT and spt4Δ cells for transcribed genes from the BY4741 experiment. D) A cartoon representation of the proposed mechanism for FACT recruitment and spreading along transcribed genes. See also Figure S7.

