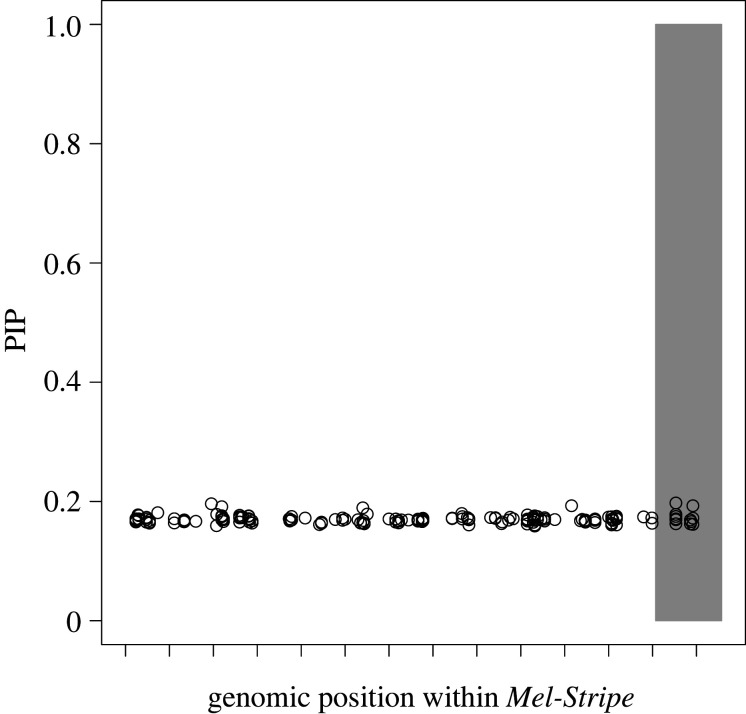
Figure 2.
Association mapping of survival within the Mel-Stripe locus when epistasis is not explicitly considered. We conducted this analysis with the software GEMMA [44,45]. The shaded grey rectangle represents the position of the indel locus within Mel-Stripe. The space between two ticks on the x-axis represents 1 megabase pair. PIP: posterior inclusion probability. The high PIP values of all SNPs (approx. 0.2) are an artefact of the MCMC method and the small number of SNPs tested, all SNPs within Mel-Stripe having some weak association with survival (see main text for further explanation).

