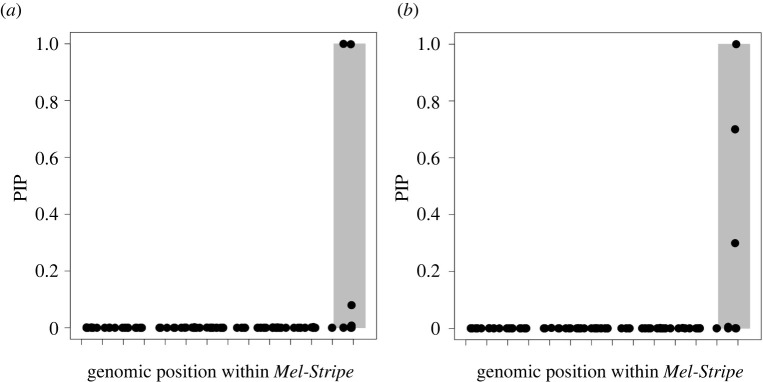
Figure 4.
Association mapping of eye coloration within the Mel-Stripe locus, when epistasis is not explicitly considered. (a) RG trait and (b) GB trait. We conducted these analyses with GEMMA [44,45]. The graphics display the results from the Mel-Stripe locus only, but because these traits are being mapped for the first time the overall analysis included genome-wide data. The shaded grey rectangles represent the position of the indel locus within Mel-Stripe. The space between adjacent ticks on the x-axis represents 1 megabase pair. PIP: Posterior inclusion probability. Because of the MCMC approach, GEMMA controls for linkage disequilibrium in the results. Only SNPs explaining trait variance will be consistently retained across MCMC steps in the model.

