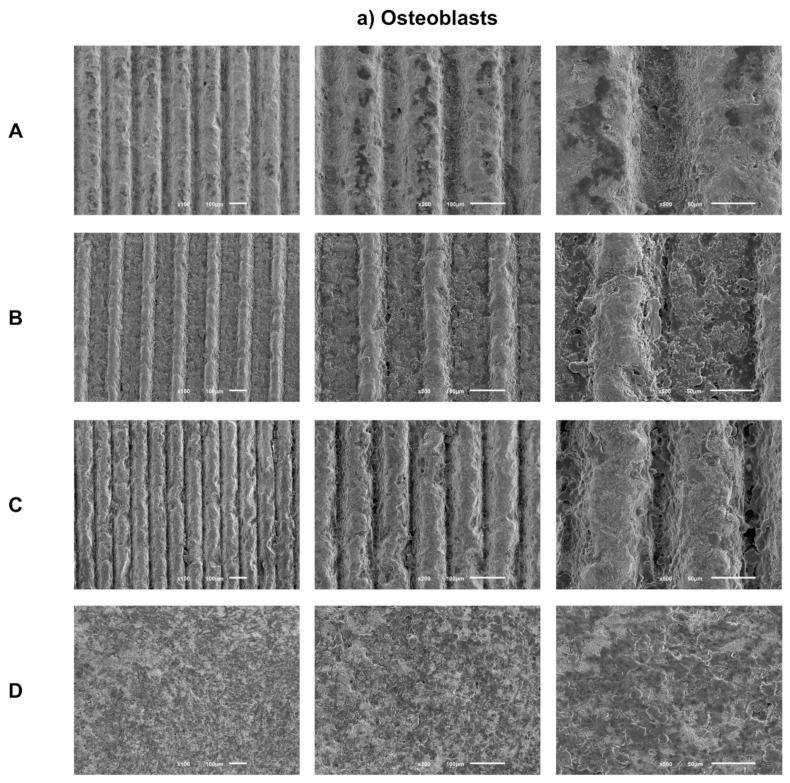
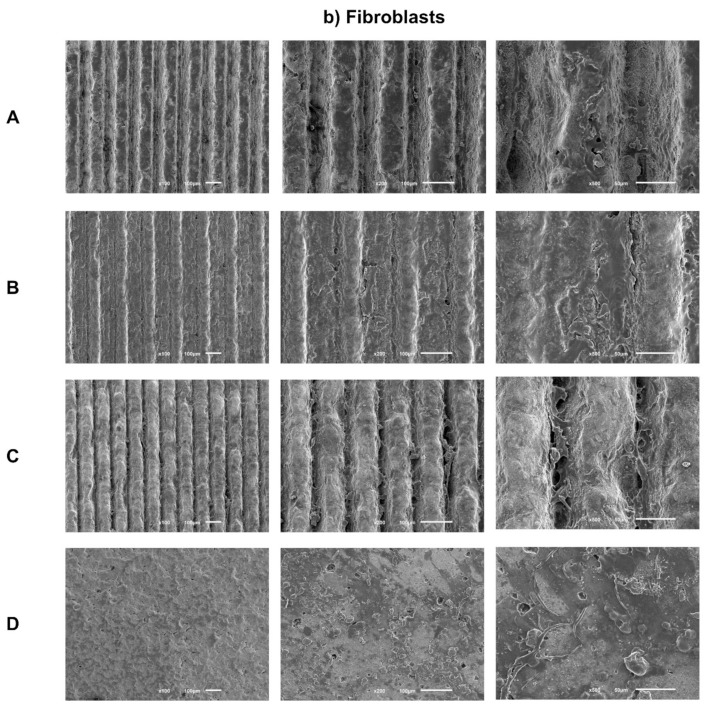
Figure 3.
(a) Representative FEG-SEM micrographs of osteoblasts cultured on test samples and control surface after 1 day, with 100, 200, and 500× magnifications for each study group (as described in Table 1). (b) FEG-SEM micrographs of fibroblasts cultured on test samples and the control surface after 1 day, with 100, 200, and 500× magnifications for each study group (as described in Table 1).


