. 2022 Apr 4;21:656–679. doi: 10.17179/excli2021-4323

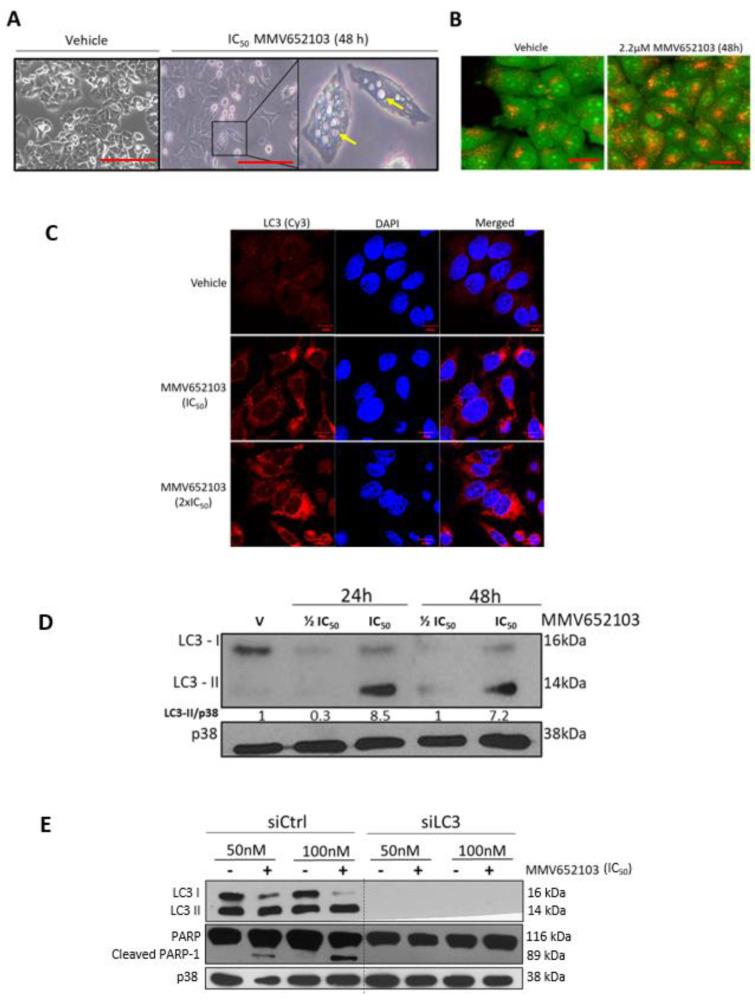
Figure 7. MMV652103 induces autophagy in MCF7 breast cancer cells. (A) Representative phase-contrast photomicrographs of MCF7 cells treated with vehicle (DMSO) and IC50 MMV652103 for 48 h. Yellow arrows indicate large vacuolar structures reminiscent of autophagic vesicles. (B) Representative confocal images (100X; EVOS XL AMEX1000 Core Imaging System; red scale bar = 100 µm) of MCF7 cells treated for 48 h with MMV652103 and stained with acridine orange (AO) which depicts the presence of acid vesicular organelles (AVOs, yellow to orange puncta). (C) Representative maximum intensity projection confocal immunofluorescence images (630X; Zeiss LSM 510; scale bar is 10 μm) from three independent experiments of MCF7 treated with IC50 and 2 x IC50 MMV652103 or vehicle for 48 h and incubated with LC3 primary antibody, fluorophore conjugated Cy3 secondary antibody and nuclei were stained with DAPI. (D) Western blotting of proteins from MCF7 cells treated with MMV652103 at IC50 and 2 x IC50 concentrations with LC3ß cleavage (LC3-I and LC3-II) analyzed at the indicated timepoints. (E) Cells transfected with non-silencing siRNA (sictrl) or LC3 specific siRNA (siLC3) and treated with MMV652103 at the IC50 concentration for 24 h and western blot analysis performed for the indicated proteins. For all western blot analysis total p38 was used as a loading control and densitometry readings were obtained using ImageJ. Protein expression levels are represented as a ratio of protein of interest/loading control normalized to a control sample. Blots are representative of at least three independent experiments.

Figure 7