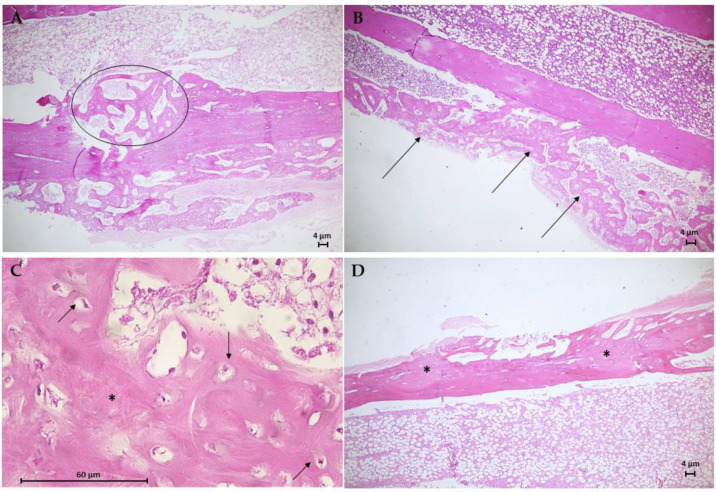
Figure 10.
Photomicrographs of bone tissue from the G3 group (A), the G4 group (B,C), and the G5 group (D). Hematoxylin–Eosin (H.E.) stain (Scale bar: 4 µm and 60 µm). (A) This longitudinal section shows the formation of reconstructive bone tissue in the critical defect (circle). (B) Presence of intramembranous ossification in the soft callus (arrows). (C) Detail of B showing developing osteons with moderated trabecular mineralization (*) and osteocytes (arrows). (D) Longitudinal section of moderate trabecular mineralization filling both ends of the critical defect.

