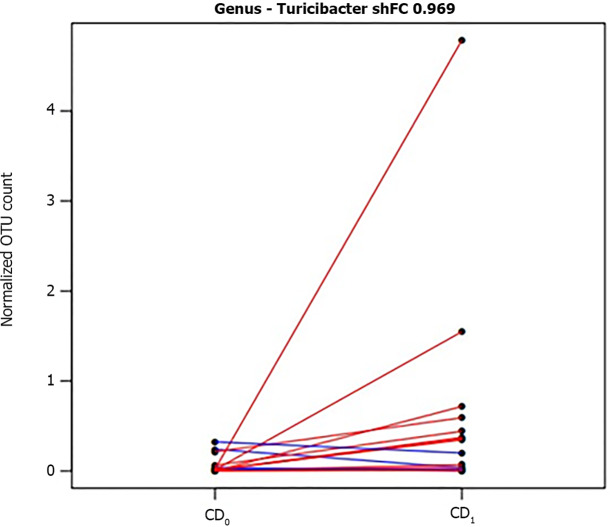
Figure 3.
Segment plot showing significantly different taxa between pre- and post-control diet. Lines link paired samples and red or blue colors respectively highlight the increase or decrease of normalized abundance for the indicated rank. Plot title reports shrinked fold change (according to the DESeq2 function lfcShrink) between pre- and post-control-wheat-diet samples. CD0: Pre-control wheat diet; CD1: Post-control wheat diet.

