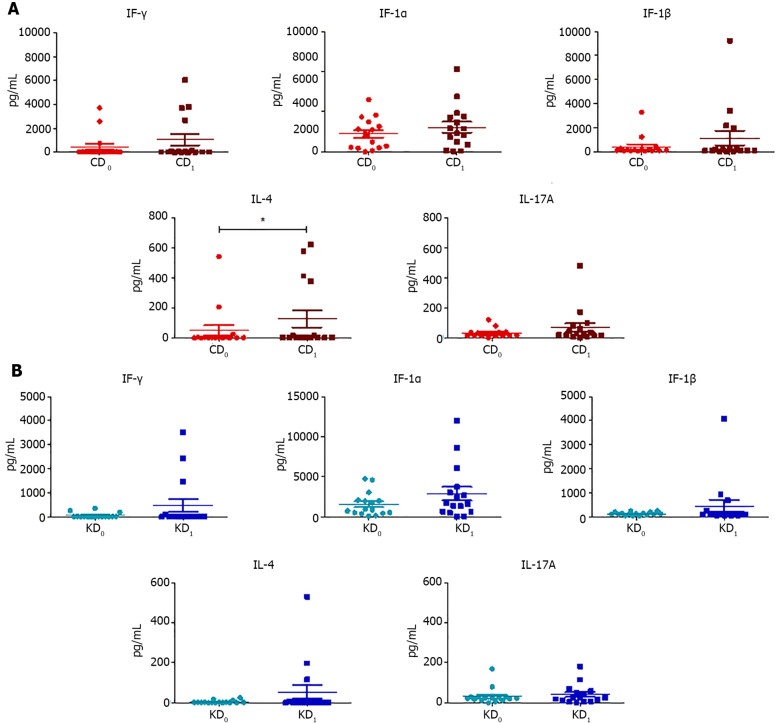
Figure 4.
Scatter plots representing the fecal concentrations of interferon-γ, interleukin-1α, interleukin-1β, interleukin-4, and interleukin-17A evaluated before and after control wheat diet and before and after Khorasan wheat diet. A: Before and after control wheat diet; B: Before and after Khorasan wheat diet. Analyses were assessed using the paired Wilcoxon signed-rank test and P values less than 0.05 were considered statistically significant. aP < 0.05, bP < 0.01, cP < 0.001. CD0: Pre-control wheat diet; CD1: Post-control wheat diet; KD0: Pre-Khorasan wheat diet; KD1: Post-Khorasan wheat diet; IL: Interleukin.

