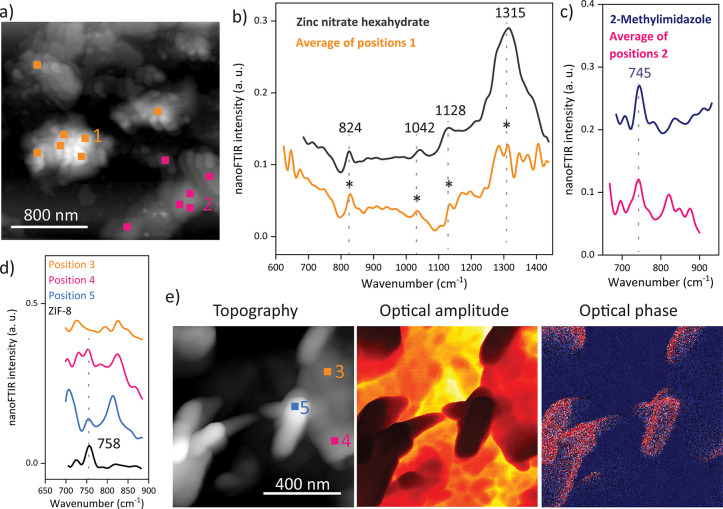
Figure 2.
Near-field IR spectroscopy of ZIF-8 with 1 min growth time. (a) The AFM image indicates the positions where the local nanoFTIR spectra (b and c) are measured, which resemble the spectra of the reactants. The curves are shifted in the y direction for a better comparison, and the spectra measured on the nanocrystals show a higher noise level than that of the nanocrystals obtained from larger quantities of reactants. The emergence of a characteristic ZIF-8 peak (d) is already observable by local probing at the positions shown in the AFM image (e), and local variations are further revealed in the optical amplitude and optical phase images (e).

