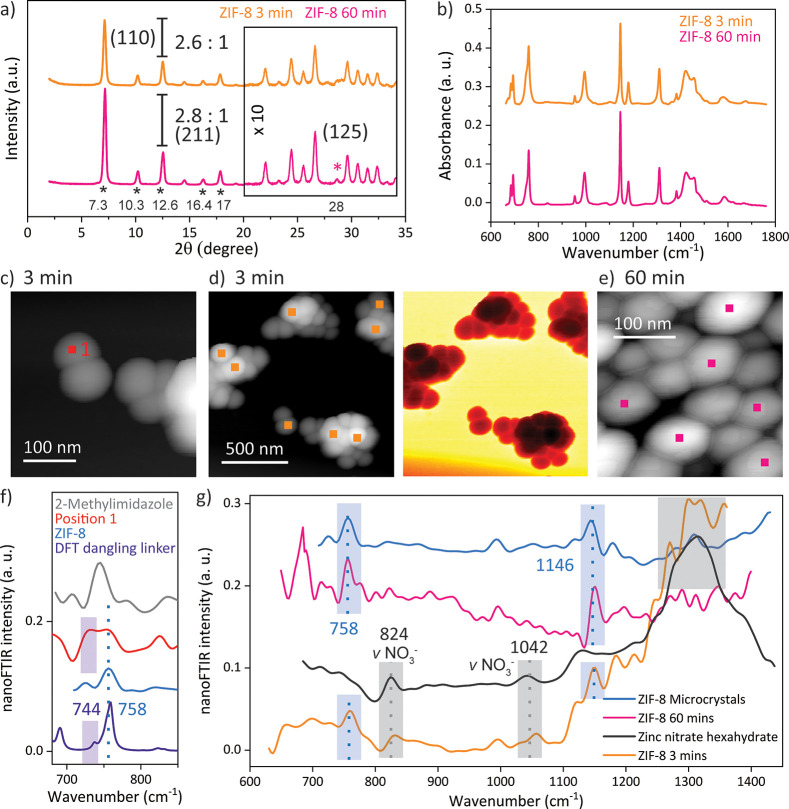
Figure 3.
Comparison between the ZIF-8 nanocrystals obtained after 3 and 60 min: (a) The XRD pattern confirms the crystallinity of the sample obtained after 3 min. (b) The ATR-FTIR spectra reveal that ZIF-8 crystals are formed after 3 min. (c and d) The topography and optical amplitude of the nanocrystals were imaged after 3 min of growth time with s-SNOM. (e) The AFM image of the final growth stage of the ZIF-8 crystals is given. (f) The nanoFTIR spectra of a 20 nm spot, as indicated in the AFM image (c), compared with the spectrum of the linker, ZIF-8, and a simulated FTIR spectrum of ZIF-8 with a dangling linker defect are given. (g) The average of several local spectra (positions illustrated in parts d and e) reveal local variations, which vanish with prolonged crystallization.

