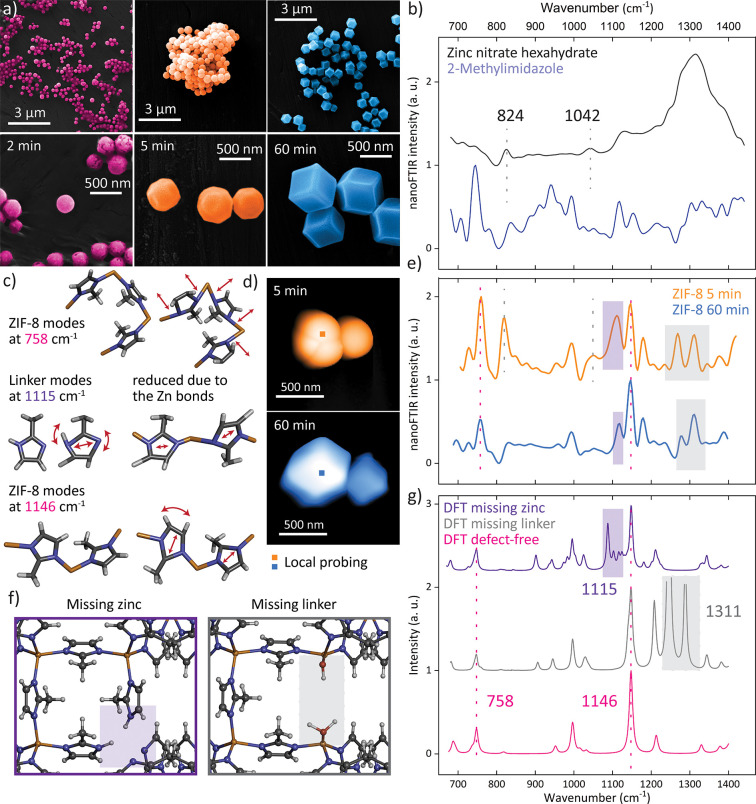
Figure 5.
Transformation of ZIF-8 microcrystals. (a) SEM imaging of ZIF-8 crystals with different growth times. (b) nanoFTIR spectra of the reactants. (c) Schematic representations of key vibrational modes. (d) AFM images of ZIF-8 crystals obtained after 5 and 60 min, indicating crystals selected for local probing. (e) Corresponding local nanoFTIR spectra obtained from the averaging of 20 point spectra on the crystal. (f) Schematic representations of the simulated defects. (g) Corresponding simulated FTIR spectra compared with a perfect ZIF-8 crystal.

