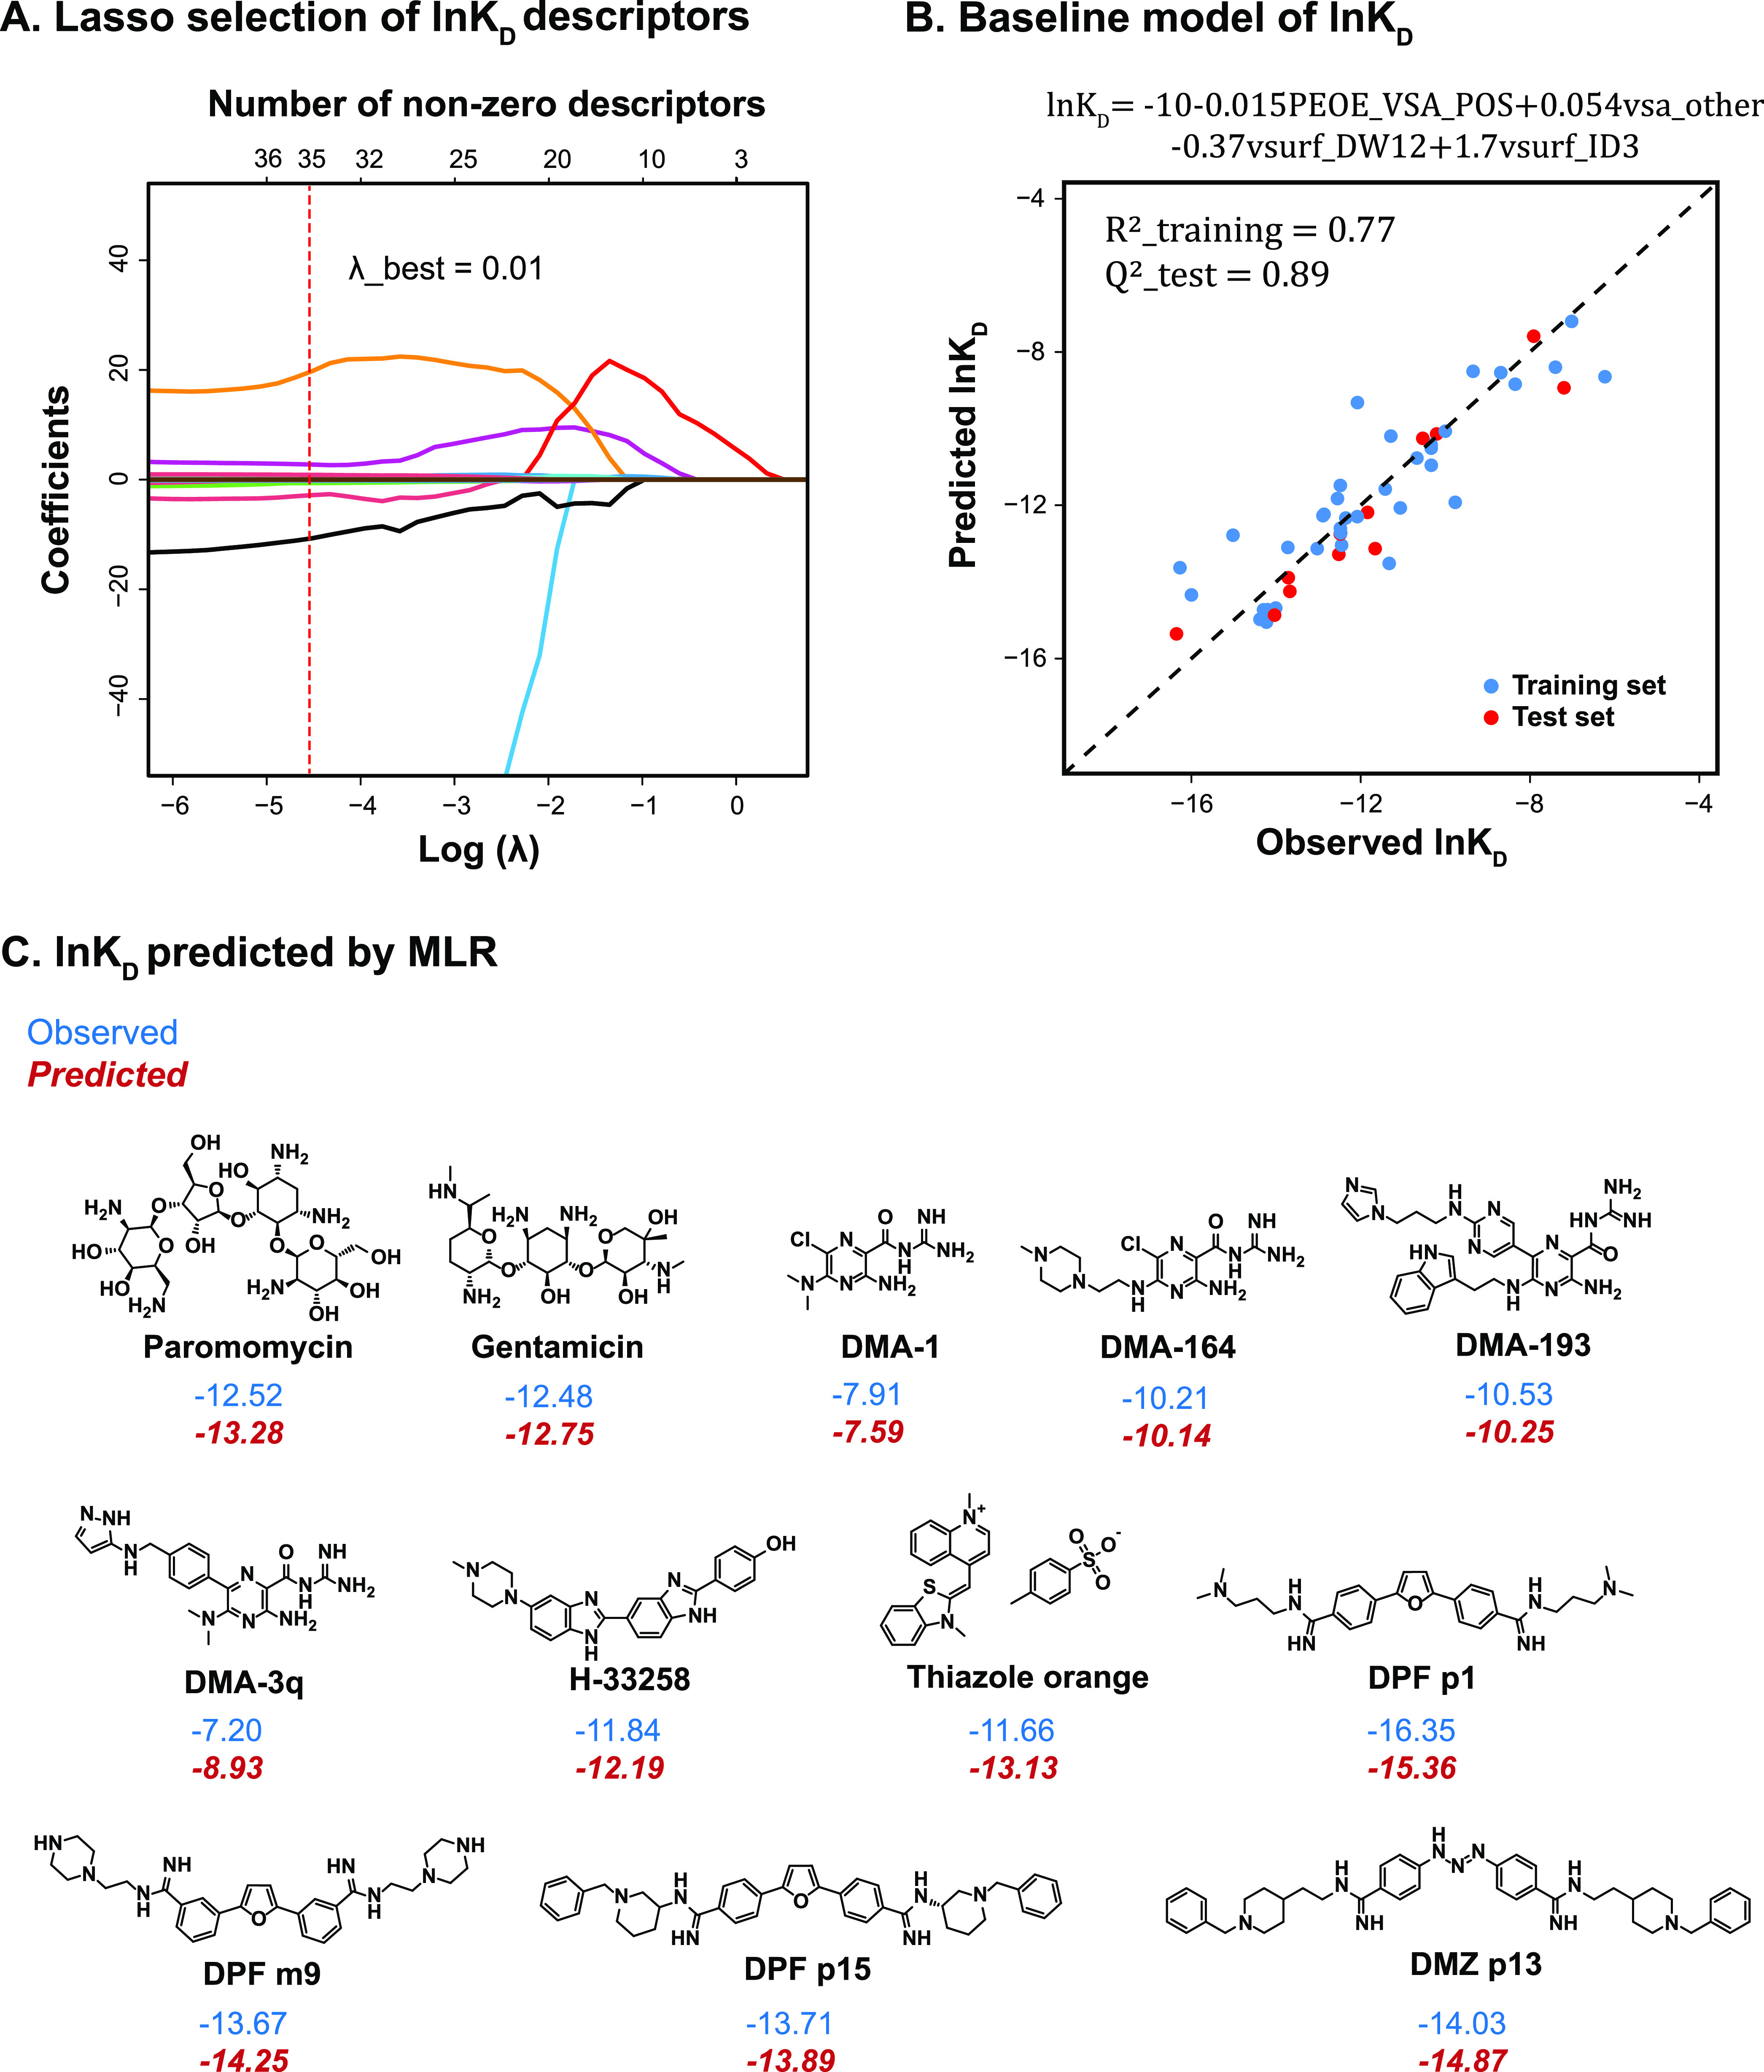
Figure 3.

A. Coefficients of ln KD descriptors were shrunk as λ increased using lasso regression; each curve with a different color represented a descriptor coefficient shrinkage; the top x-axis showed the number of descriptors with nonzero coefficients at a specific λ value that was indicated by the bottom x-axis. The best λ value (0.01) was determined by the 5-fold cross validation. B. Observed ln KD (both training and test sets) was plotted with the value predicted by the MLR baseline model shown at the top. C. Small molecules from the test set were predicted by MLR of the ln KD value (in red italics) versus the observed values (in blue).
