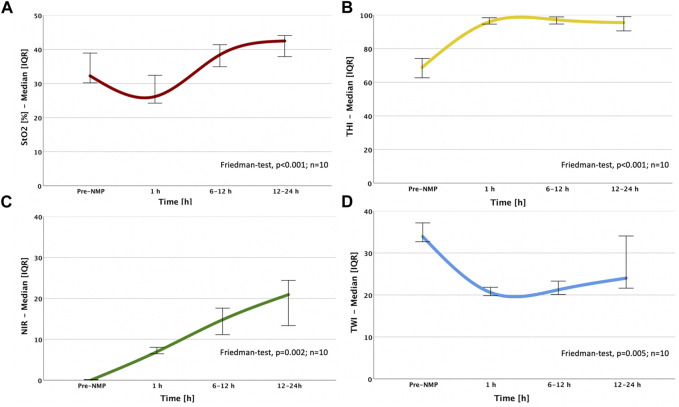
FIGURE 2.
Dynamic changes of HSI indices over NMP time: (A) StO2; (B) THI; (C) NIR; (D) TWI; the sample size (n = 10) indicates that the Friedman test was calculated based on the ten livers perfused over 12 h and therefore, all NMP time points could be included in the statistical analysis. StO2, Tissue Oxygen Saturation; THI, Tissue Hemoglobin Index; NIR, Near-Infrared Perfusion Index; TWI, Tissue Water Index.

