Figure 1.
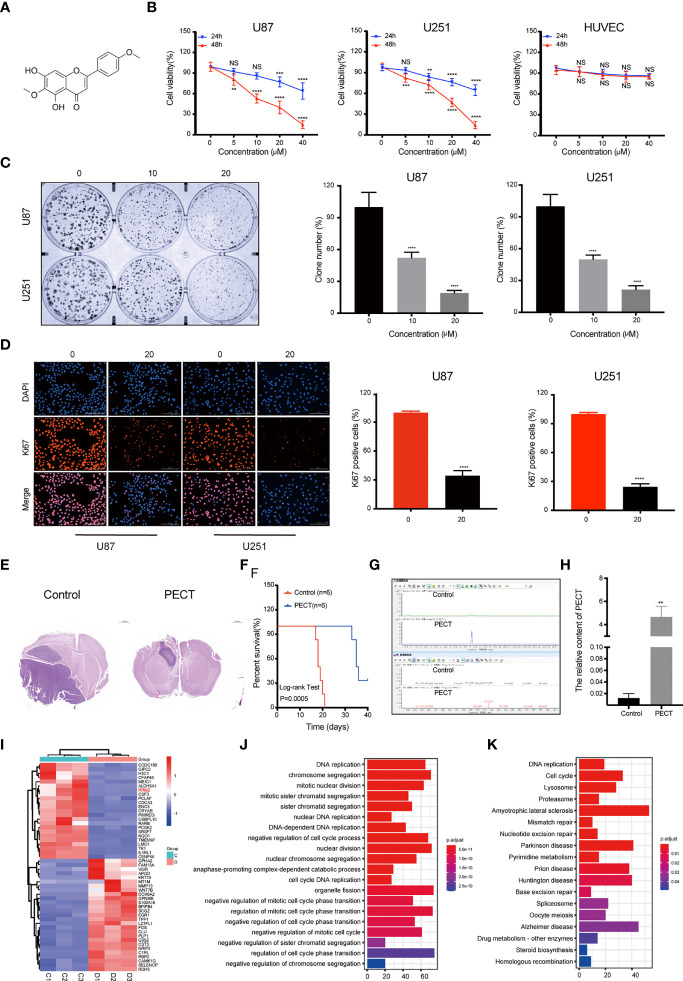
PECT inhibits GBM cells proliferation both in vitro and in vivo, and RNA-sequencing analysis. (A) Structure of PECT. (B) After exposuring to different concentrations of PECT for 24 or 48 h, cell viability of U87, U251 and HUVECs cells was assessed using MTT. (C) Representative images of colony formation on U87 and 251 cells treated with PECT for different concentrations. (D) After U87 and U251 cells were cultured with or without PECT (20 μM, 48 h), Ki67 staining was observed by fluorescence microscopy. Scale bar: 200 μm. (E) H&E images of brain sections of mice orthotopically xenografted tumor with U251 cells treated with PECT. Scale bar: 1000 μm. (F) Kaplan-Meier survival curve of mice orthotopically xenografted tumor with U251 cells treated with PECT. (G, H) LC-MS analysis of PECT content in the tumor bearing mice brain homogenate samples. (I) Heatmap of top 50 up- or down-regulated DEGs after PECT treatment. C1-3: control group, D1-3: PECT-treated group. (J) GO and (K) KEGG analysis of DEGs. The data are presented as the mean ± SD (n=3). NS, non-significant. **P < 0.01, ***P < 0.001, ****P < 0.0001.

