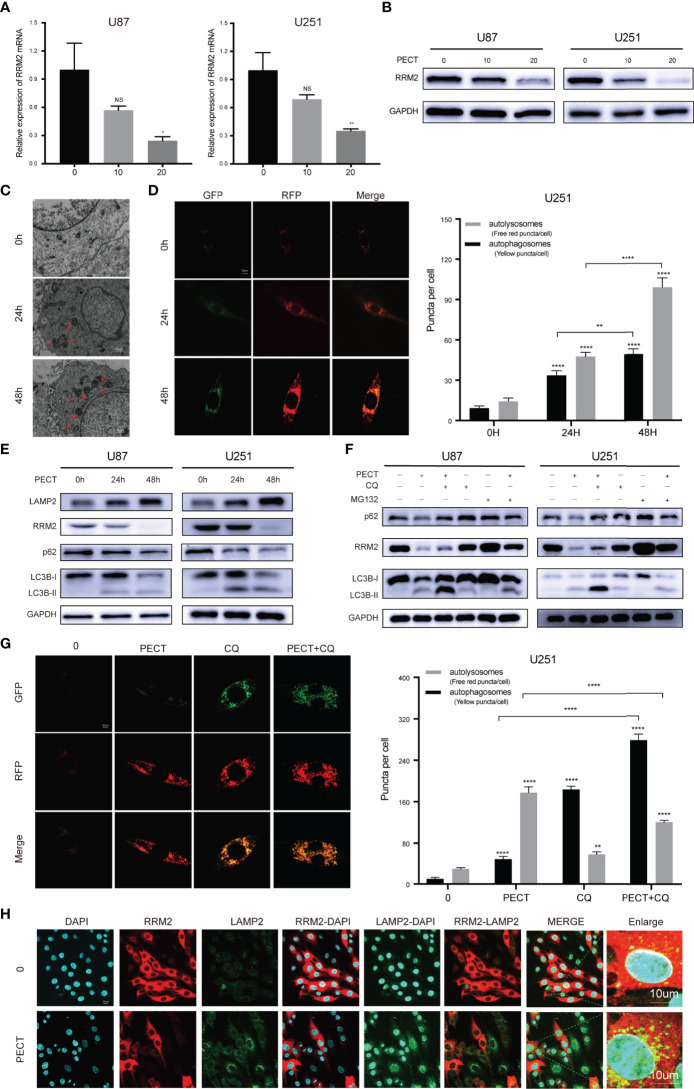
Figure 2.
PECT downregulates RRM2 expression and increases autophagy flux in vitro. (A, B) After culturing U87 and U251 cells with different concentrations of PECT for 48h, RRM2 mRNA and protein expression were examined by qRT-PCR and western blot assay, respectively. (C) TEM images of U251 cells exposed to PECT (20 μM) for 0h, 24h, and 48 h. Autophagic vacuole (red arrows). Scale bar: 10 μm. (D) After U251 cells cultured with PECT (20 μM) for 0h, 24h, and 48 h, autophagic flux was analyzed using the RFP-GFP-LC3 construct. Scale bar: 20 μm. (E) Western blot analysis of RRM2, p62, LC3B and LAMP2 protein expression in U87 and U251 cells cultured with PECT (20 μM) for 0h, 24h, and 48 h. (F) Western blot analysis of RRM2, p62 and LC3B protein expression in U87 and U251 cells cultured with PECT (20 μM, 48 h) or CQ (2 μM, 2 h) or MG132 (2 μM, 3 h). (G) After U251 cells cultured with PECT (20 μM, 48h) or CQ (2 μM, 2h), autophagic flux was analyzed using the RFP-GFP-LC3 construct. Scale bar: 20 μm. (H) Immunofluorescence analysis of RRM2 (red) and LAMP2 (green) in U251 cells treated with or without PECT(20 μM, 48 h). The nuclei were stained with DAPI. Scale bar: 10 μm. The data are presented as the mean ± SD (n=3). NS, non-significant. *P < 0.05, **P < 0.01, ****P < 0.0001.

