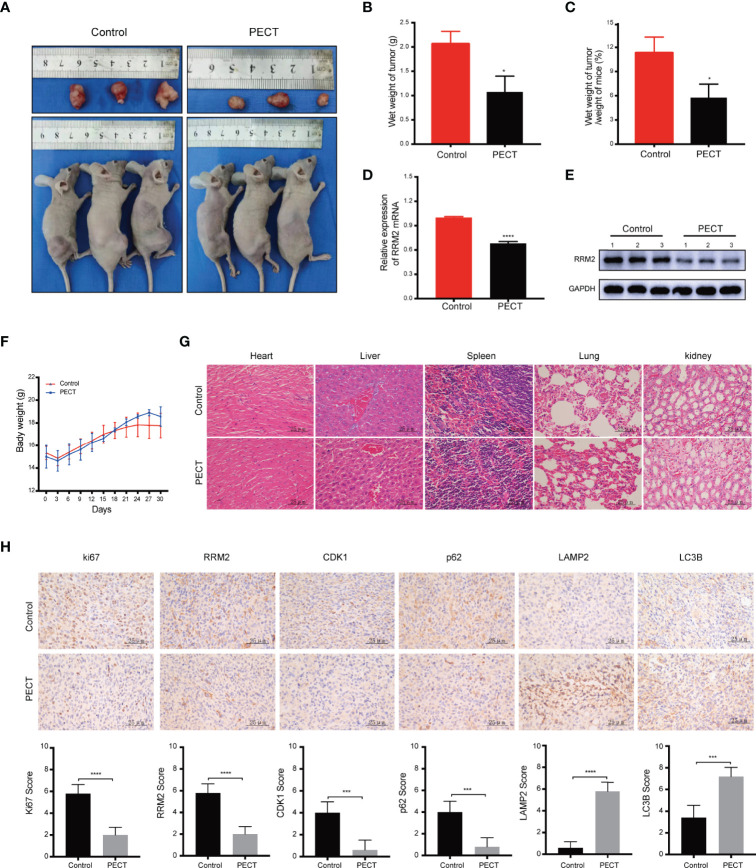
Figure 6.
PECT inhibits GBM proliferation in vivo. (A) Dissected images of mices and tumors, (B) tumor wet weight and (C) wet weight of tumor/weight of mice between the control and PECT groups. (D, E) RRM2 mRNA and protein expressions in mouse tumors with or without PECT treatment. (F) Body weight changes in the mouse models. (G) Representative images of H&E staining of the organs from mice with or without PECT treatment. Scale bar: 25 μm. (H) IHC staining for Ki67, RRM2, CDK1, p62, LAMP2, and LC3B in xenograft tumors between the control and PECT groups. Scale bar: 25 μm. The data are presented as the mean ± SD (n=3). *P < 0.05, ***P < 0.001, ****P < 0.0001.

