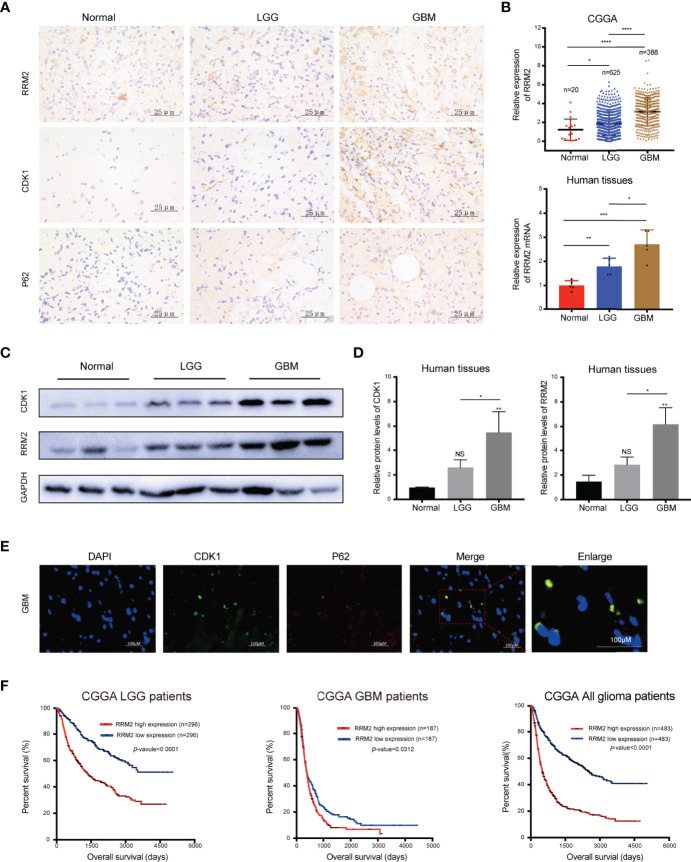
Figure 7.
RRM2 is increased in GBM tissues and inversely correlated with the prognosis of glioma patients. (A) IHC analysis of RRM2, CDK1, and p62 in sections obtained from primary glioma sample tissues and normal human brain sample tissues. (B) Analysis of RRM2 mRNA expression in GBM samples compared to normal human brain samples and LGG samples according to the CGGA data and qRT-PCR results. (C, D) WB analysis of RRM2 and CDK1 in GBM sample tissues compared to normal human brain sample tissues and LGG sample tissues. (E) Immunofluorescence double-staining analysis showing co-localization of p62 and CDK1 in the same lesional cells in human GBM cases. (F) OS curves of patients with glioma according to the median of RRM2. The data are presented as the mean ± SD (n=3). NS, non-significant. *P < 0.05, **P < 0.01, ***P < 0.001, ****P < 0.0001.

