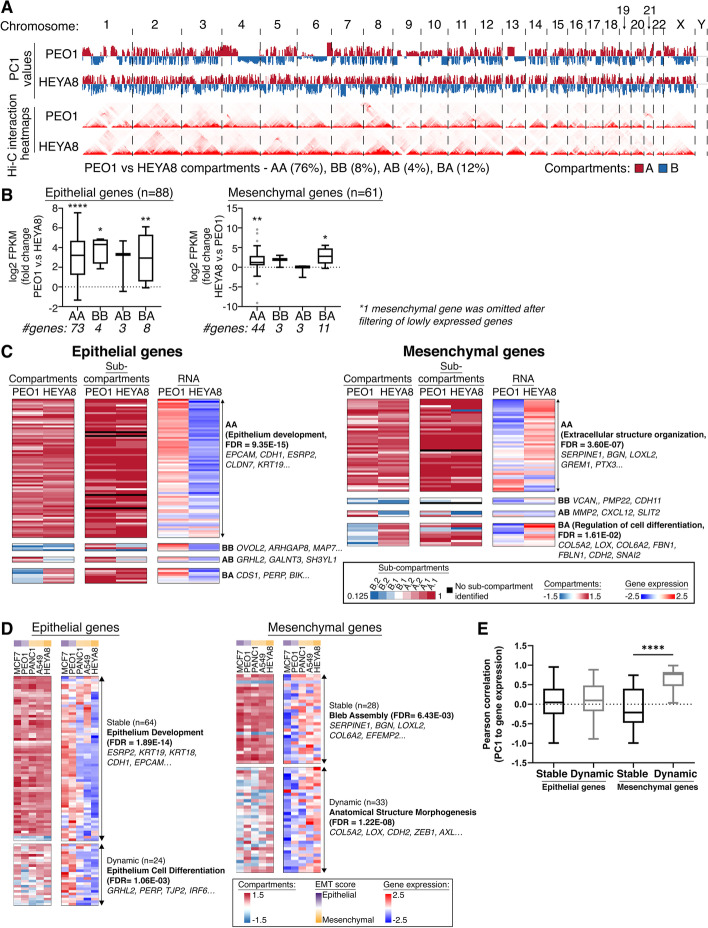
Fig. 2.
a Top panels: genome-wide (x-axis) compartments A (red) and B (blue) in PEO1 and HEYA8 based on the PC1 values (y-axis); bottom panels: genome-wide Hi-C interaction heatmaps in PEO1 and HEYA8. b Box plots showing fold change of log2 FPKM expression (y-axis) of 88 epithelial (left) and 61 mesenchymal (right) genes categorized by the compartment changes (x-axis; AA, BB, AB, BA) between PEO1 versus (v.s) HEYA8. P values were obtained by Wilcoxon test, *p<0.05, **p<0.01 and ****p<0.0001. c Heatmaps of the 2 major compartments A (red) and B (blue), sub-compartments A.1.1 (dark red), A.1.2 (red), A.2.1 (light red), A.2.2 (pale red), B.1.1 (white), B.1.2 (light blue), B.2.1 (blue), and B.2.2 (dark blue), and RNA expression in the scale of Z-scores of epithelial and mesenchymal genes in PEO1 and HEYA8. The GO terms for the compartment switches (AA, BB, AB, and BB) are shown at the right of the RNA expression heatmap, where available. d Heatmap of the 2 major compartments A (red) and B (blue) and RNA expression in the scale of Z-scores of epithelial and mesenchymal genes in MCF7 (dark purple), PEO1 (light purple), PANC1 (pale yellow), A549 (light yellow), and HEYA8 (dark yellow) of different EMT scores along the spectrum. The GO terms for the stable or dynamic compartment changes are shown at the right of the RNA expression heatmap, where available. e Box plot of Pearson correlation (y-axis) between the PC1 values of the major compartments and expression of epithelial and mesenchymal genes based on the stable or dynamic compartment changes (x-axis)

