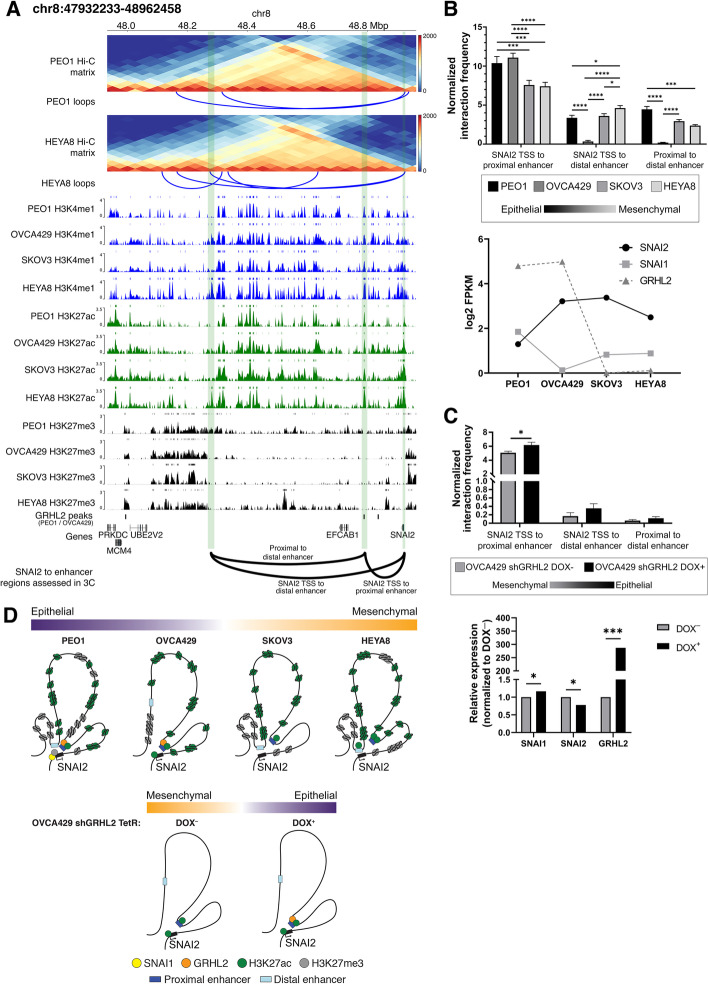
Fig. 5.
a Triangular Hi-C matrix depicting the Hi-C counts at SNAI2 TAD in PEO1 (top Hi-C matrix) and HEYA8 (bottom Hi-C matrix). The loops (blue solid lines) identified from the Hi-C data are shown below their respective Hi-C matrices. Histone marks in the 4 ovarian cancer cell lines are shown below the Hi-C matrices. H3K4me1, H3K27ac, and H3K27me3 are represented by indigo, green, and black respectively. GRHL2 binding regions (GRHL2 peaks) at SNAI2 TAD are shown below the histone marks tracks. The gene track (hg38) is shown below the GRHL2 peaks. The green stripes correspond to the regions at the SNAI2 TAD: SNAI2 gene, proximal enhancer, and distal enhancer. The solid arcs represent the interacting loci that were used in assessing interaction frequency by 3C-qPCR, “SNAI2 TSS to proximal enhancer,” “SNAI2 TSS to distal enhancer,” and “proximal to distal enhancer.” b Bar chart representation of 3C-qPCR normalized interaction frequencies between interacting loci as annotated in a. The normalized interaction frequency (y-axis) at the interacting loci (axis) were shown in 4 ovarian cancer cell lines (PEO1—black, OVCA429—dark grey, SKOV3—grey, and HEYA8—light grey), representing different EMT states across the EMT spectrum (epithelial—black, mesenchymal—light grey). RNA-seq log2(FPKM) expression of SNAI1 (solid grey line with square symbol), SNAI2 (solid black line with circle symbol), and GRHL2 (dotted dark grey line with triangle symbol) is shown below the bar chart for the respective cell lines. Student’s t tests were used for statistical analyses. *p<0.05, ***p<0.001, and ****p<0.0001. c Bar chart representation of 3C-qPCR normalized interaction frequencies between interacting loci as annotated in a. The normalized interaction frequency (y-axis) at the interacting loci (x-axis) were shown in OVCA429 shGRHL2 DOX– (dark grey; mesenchymal state) and OVCA429 shGRHL2 DOX+ (black; epithelial state). 3C-qPCR showing normalized interaction frequencies between SNAI2 TSS and its proximal/distal enhancers in OVCA429 shGRHL2 Tet-inducible cell line (epithelial state—black, mesenchymal state—grey). Bar chart representation of log2 fold change (y-axis) of SNAI1, SNAI2, and GRHL2 (x-axis) between OVCA429 shGRHL2 DOX– (dark grey) and OVCA429 shGRHL2 DOX+ (black) is shown below the 3C-qPCR bar chart. The log2 fold change expression (y-axis) was determined by RT-qPCR. Student’s t tests were used for statistical analyses. *p<0.05 and ***p<0.001. d Illustration of local chromatin structure at SNAI2 locus in the 4 ovarian cancer cell lines (PEO1—purple, OVCA429—light purple, SKOV3—light orange, and HEYA8—orange) representing different EMT states along the spectrum, as well as the changes in chromatin conformation at SNAI2 locus as the cell transits from a mesenchymal (OVCA429 shGRHL2 DOX–, orange) to epithelial (OVCA429 shGRHL2 DOX+, purple) state. The representations of the proteins, histones, and enhancer at the SNAI2 locus are as indicated: SNAI1—yellow circle, GRHL2—orange circle, H3K27ac—green circle, H3K27me3—grey circle, proximal enhancer—dark blue rectangle, and distal enhancer—light blue rectangle. The SNAI2 gene is represented by a black rectangle and the SNAI2 TSS is indicated by the black arrow appended at its side

