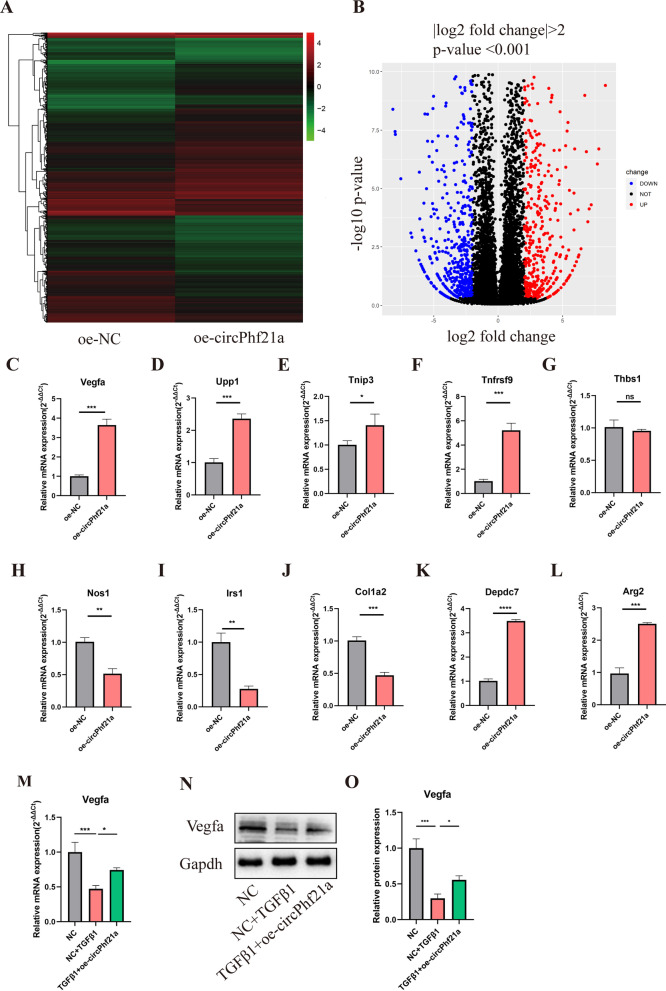
Fig. 6.
The regulation mechanism of circPhf21a was determined by RNA-sequencing and RT-qPCR. A Heatmap of the differentially expressed genes, with | log2 (fold change) | > 2 and p < 0.001, between PMCs transfected with oe-NC and oe-circPhf21a plasmid. PMCs transfected with oe-NC are the control for the experiment. Red rectangles represent high expression, and green rectangles represent low expression. B Volcano plot of the differentially expressed mRNAs between PMCs transfected with oe-NC and oe-circPhf21a plasmids. The red plots represent upregulated genes, the black plots represent nonsignificant genes, and the blue plots represent downregulated genes. C–L The mRNA expression levels of the 10 most differentially expressed genes were detected by RT-qPCR. n = 3, *p < 0.05, **p < 0.01, ***p < 0.001, ****p < 0.0001. M, N PMCs were incubated with negative control vector or TGF-β1 with or without oe-circPhf21a. After 48 h of incubation, mRNA and protein expression levels of Vegfa were detected by RT-qPCR or western blotting analysis. n = 3, *p < 0.05, ***p < 0.001

