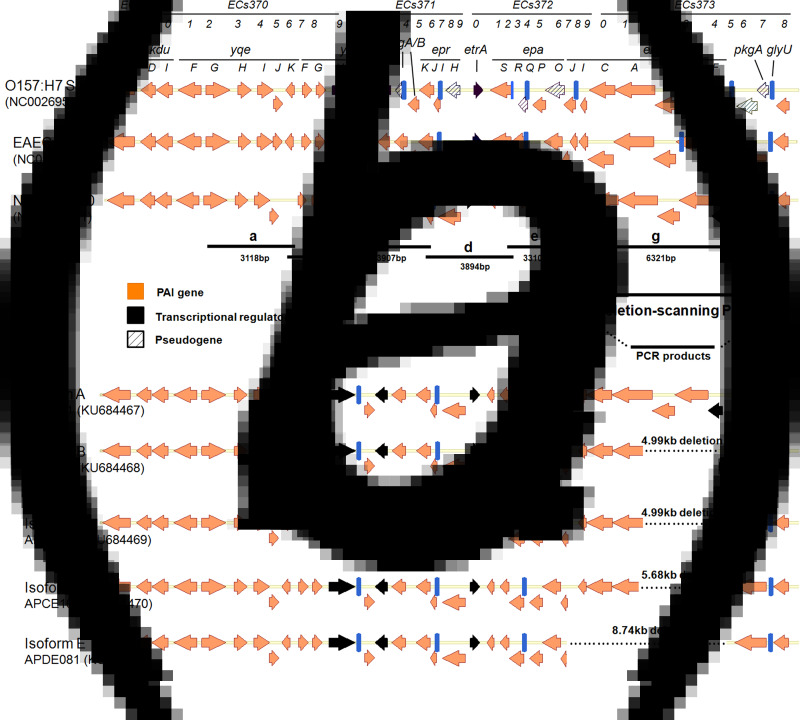
Fig. 1.
ETT2 structures and lengths of TP-PCR products. (a) Structure of the ETT2 pathogenicity island in EHEC O157:H7, EAEC 042 and NMEC CE10. Homologous genes are vertically aligned with the transcriptional regulator encoding gene shown as black and the pseudogene as a grid. (b) Bold lines indicate the size of the PCR products, and deletion-scanning PCR. (c) Length of gene deletion or insertion of ETT2 isoforms in APEC isolates.

