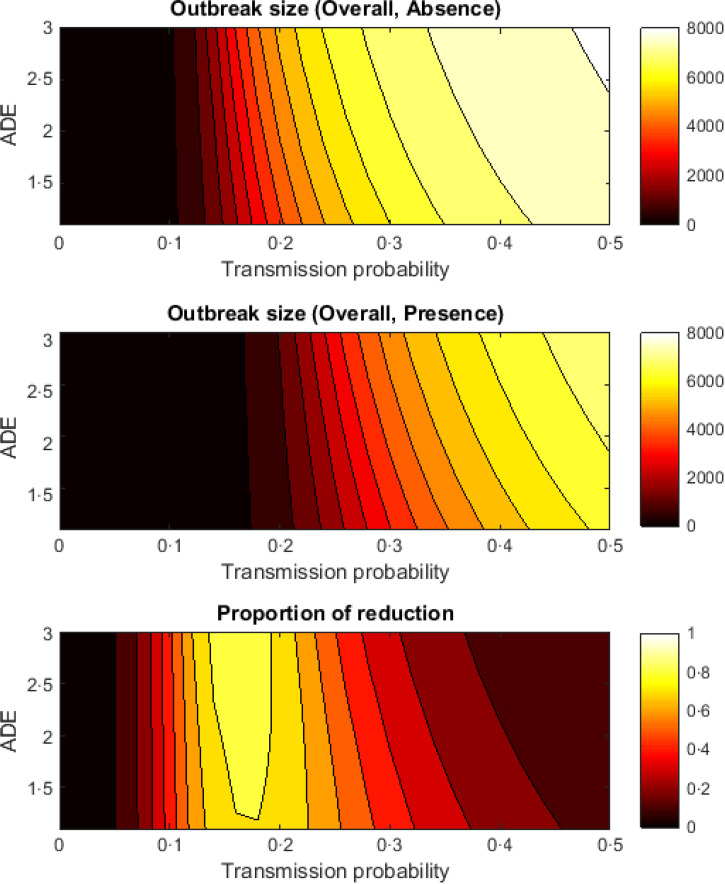
Fig. 3.
Contour plot showing simultaneous changes to the antibody-dependent enhancement (ADE) factor and transmission probability. The top and middle plots give the outbreak size in the absence and presence of Wolbachia-carrying mosquitoes. The bottom plot shows the proportional reduction in dengue due to Wolbachia.

