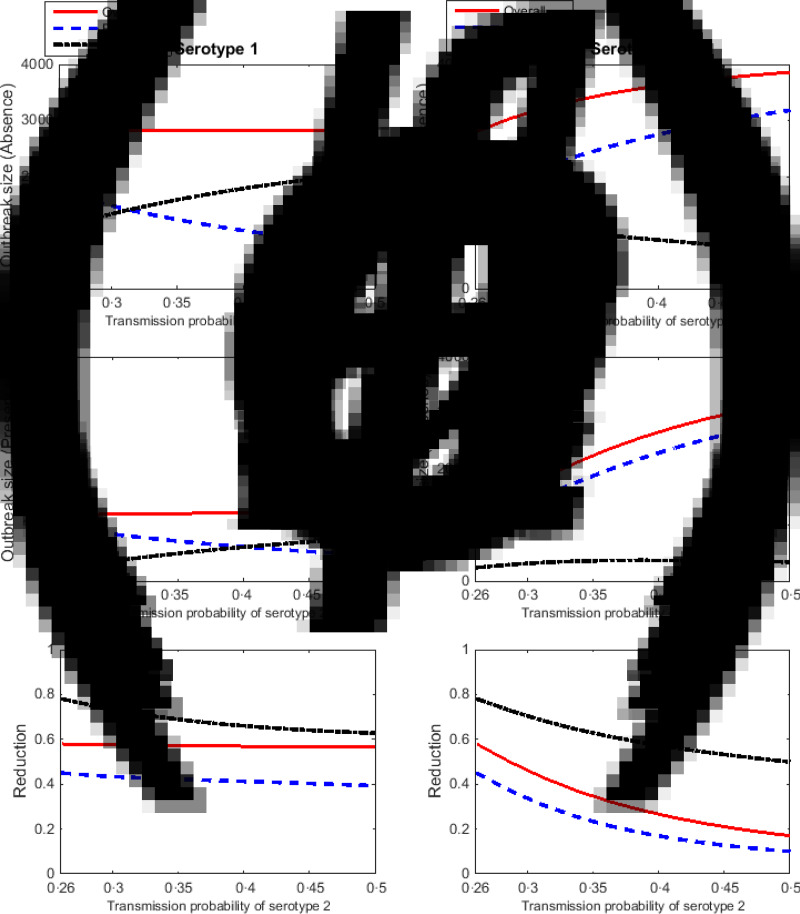
Fig. 5.
The effect of changes in the transmission probability of serotype 2 while the transmission probability of serotype 1 is fixed. All plots show the overall (solid red lines), primary (dashed blue lines) and secondary (dash-dot black lines) infections. Plots show the outbreak size in the absence (a, d) and presence (b, e) of Wolbachia-carrying mosquitoes. Plots (c) and (f) show the proportional reduction in dengue incidence due to Wolbachia. The left-hand plots (a–c) show serotype 1 and the right-hand plots (d–f) show serotype 2.

