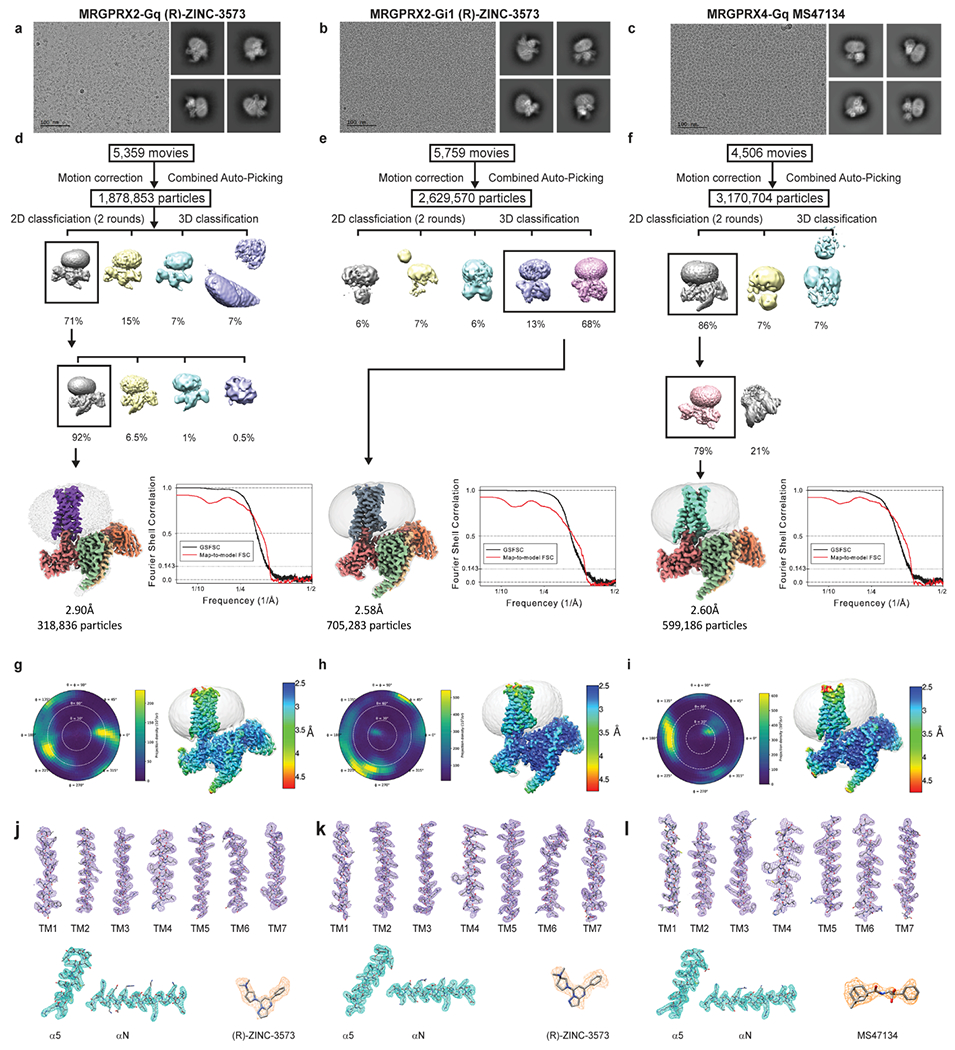
Extended Data Fig. 2 |. CryoEM images and data-processing of MRGPRX2-Gq-(R)-ZINC-3573, MRGPRX2-Gi-(R)-ZINC-3573 and MRGPRX4-Gq-MS47134 complex.

a-c, Representative motion corrected cryo-EM micrographs (scale bar, 100 nm) of respective ligand bound GPCR heterotrimeric complex particles imaged at a nominal 45k x magnification and representative two-dimensional class averages. The experiment was repeated three times with similar result. The exact number of movies and particles used for each complex are shown in the flow chart. d-f, Flow chart of cryo-EM data processing, GSFSC plot of auto-masked final map (black) and map-to-model real-space cross correlation (red) as calculated form phenix.mtriage. g-i, Respective polar plots of particle angular distributions and local resolution estimations heat maps. j-l, Local cryo-EM density maps of TM1-7, respective ligands, and α5 and αN helix of respective G-protein.
