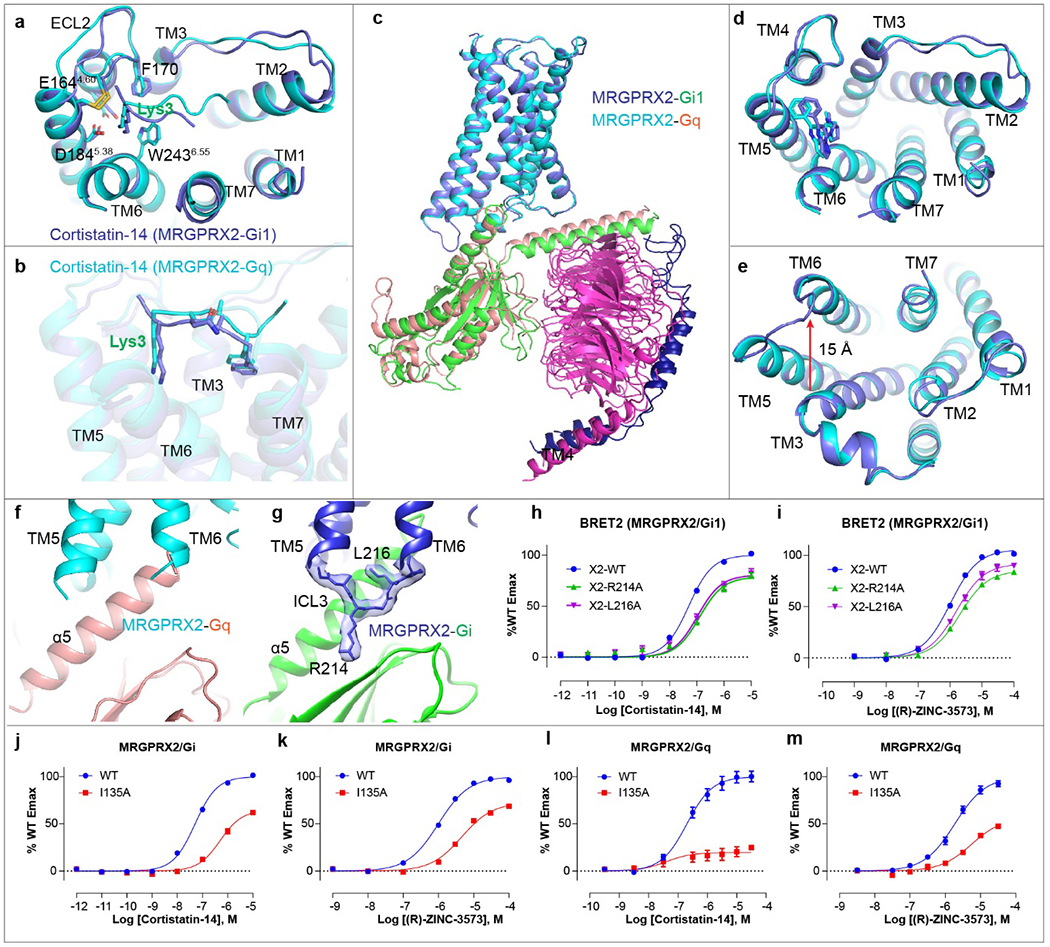
Extended Data Fig. 4 |. Structural comparison of Gq- and Gi-coupled MRGPRX2 complex.

a-b, Structural comparison of the MRGPRX2-Gi1-cortistatin-14 complex (blue) with MRGPRX2-Gq-cortistatin-14 complex (cyan). Top view for the key interactions in sub-pocket 1 (a). Side view to show the overall conformational of cortistatin-14 (b). c-e, structural comparison of MRGPRX2-Gi1-(R)-ZINC-3573 complex with MRGPRX2-Gq-(R)-ZINC-3573 complex. Gi1 and Gq are shown in green and salmon, respectively. Gi1 coupled MRGPRX2 and Gq coupled MRGPRX2 are shown in blue and cyan, respectively. Side view of the whole complex (c), top view (d) and bottom view (e) of MRGPRX2. f, ICL3 of Gq is not clearly resolved in the Gq-coupled MRGPRX2 complex. g, Close up view of the ICL3 in the Gi1-coupled MRGPRX2 structure with surrounding EM map at a threshold of 0.14. h-i, MRGPRX2 ICL3 mutations R214ICL3A and L216ICL3A impairs cortistatin-14 (h) and (R)-ZINC-3573 (i) stimulated Gi1 activation. Data represent mean ± SEM of n = 3 biological replicates. j-k, BRET2 Gi assays reveal that I135ICL2A mutation of MRGPRX2 attenuate cortistatin-14 (j) and (R)-ZINC-3573 (k) stimulated Gi1 activation. Data represent mean ± SEM of n = 3 biological replicates. l-m, BRET2 Gq assays reveal that I135ICL2A mutation of MRGPRX2 greatly reduced cortistatin-14 (l) and (R)-ZINC-3573 (m) stimulated Gq activation. Data represent mean ± SEM of n = 3 biological replicates.
