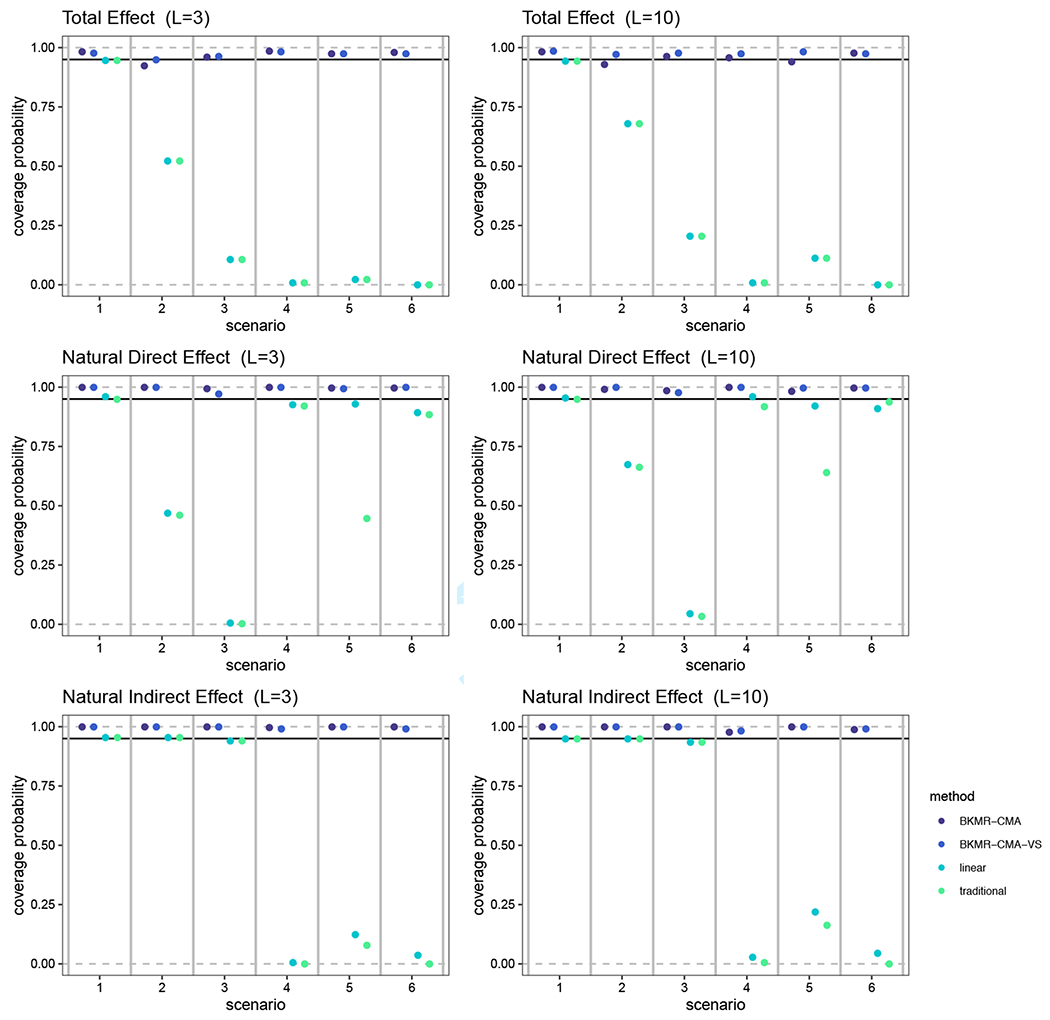
FIGURE 4.

A comparison of the coverage probability from our simulation when the TE, NDE and NIE are estimated by our BKMR-CMA and BKMR-CMA-VS approaches, the linear method, and the traditional method. The coverage probability is defined as the proportion of the estimates and 95% credible or confidence intervals in the 500 simulation datasets that contain the truth for each effect. The black line represents a coverage probability of 0.95. Results are shown for six different data generation scenarios and when the number of mixture components is three and ten. The specific data generation functions used for each simulation scenario are defined in Table 1.
