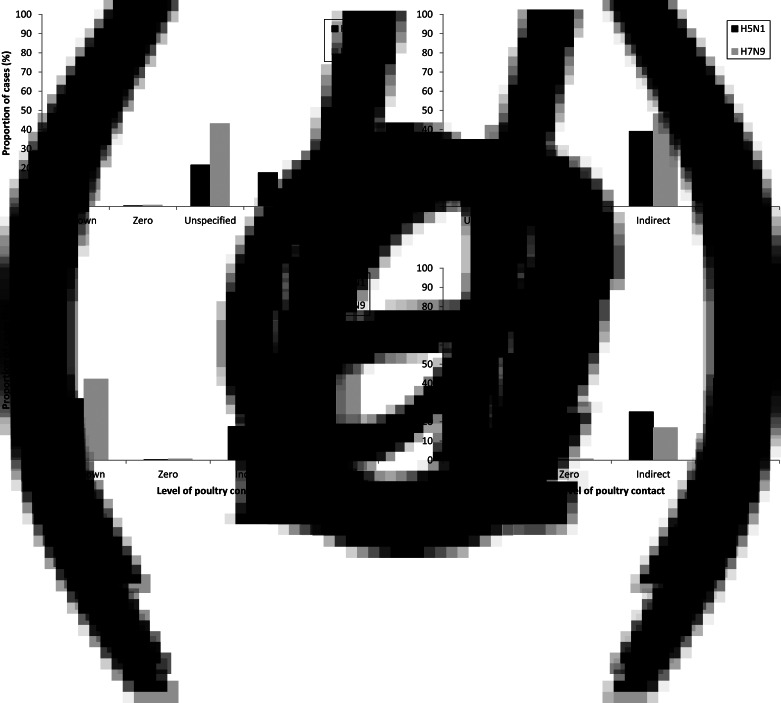
Fig. 2.
Proportion of H5N1 (n = 678) and H7N9 (n = 452) cases in each poultry contact category in the case population. (a) Unspecified contact cases categorized separately; (b) unspecified contact cases added to indirect contact; (c) unspecified contact cases added to direct contact; (d) unspecified contact cases proportionally distributed to indirect and direct contact in same proportions as original indirect and direct contact categories in case population.

