Figure 4.

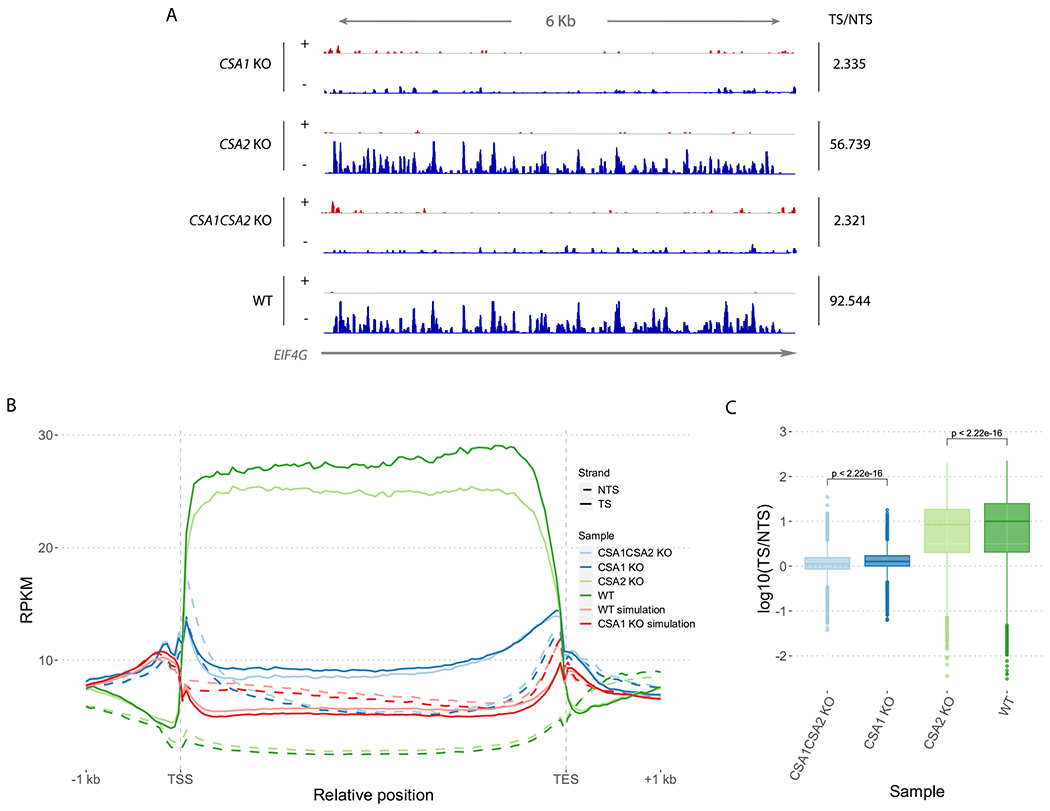
Repair profiles for XR-seq datasets. (A) Screenshot of repair profiles on EIF4G house-keeping gene. Integrative Genomics Viewer is used to visualize strand-specific XR-seq data of knock-out and wild-type samples. Plus and minus DNA strands are represented by + and − symbols. Gray horizontal line represents the EIF4G gene and the arrow indicates its direction on the genome. TS/NTS ratios on EIF4G gene for each sample are given on the right. (B) Normalized XR-seq read counts on Araport11 protein-coding genes. 1 kb upstream of TSS and downstream of TES are also included in the genic regions. XR-seq data for wild-type and knock-out samples as well as simulated XR-seq data for simulated csa1 and WT samples are included. Two replicates from each sample are merged. (C) TS/NTS ratios for XR-seq samples on Araport11 protein-coding genes. Merged replicates of knockout and WT samples are included. Significance of the difference between samples are determined using Wilcoxon test. RPKM: Reads Per Kilobase of transcript per Million mapped reads, TSS, Transcription start site; TES, Transcription end site.
