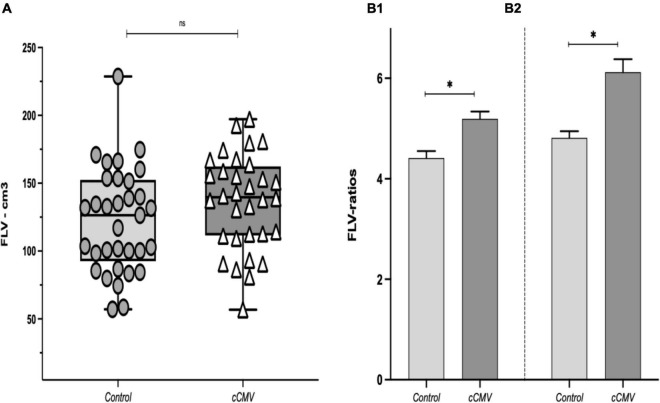
FIGURE 3.
(A) Fetal liver volume (FLV) between study groups, data presented as median (IQR: interquartile range: p25–p75). [*p-value as determined with the Wilcoxon rank-sum test (Mann-Whitney U); p = 0.22]. (B1) FLV/AC-ratio (cm3/cm), and (B2) FLV/FBV-ratio between the study groups. Data presented as mean (SD). *p-value as determined with the t-test; p < 0.001 in both. cCMV: congenital cytomegalovirus fetuses (n = 32). Controls: (n = 33). AC, abdominal circumference; FBV, fetal body volume.

