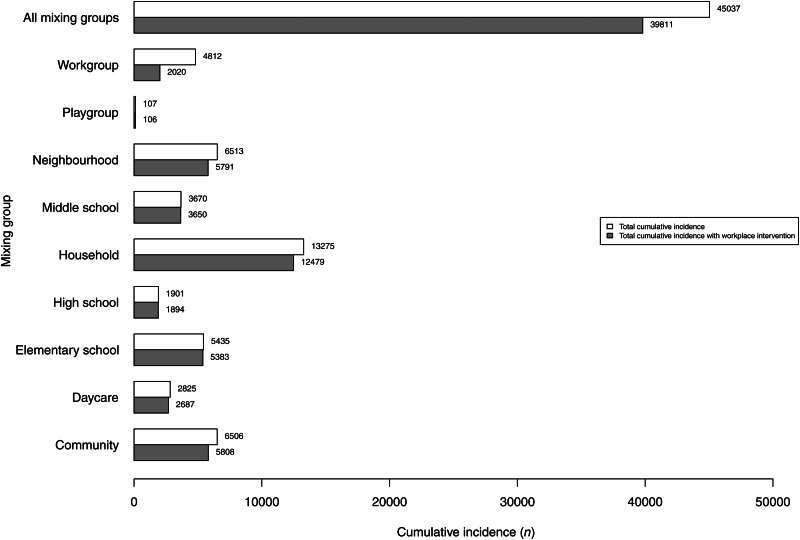
Fig. 3.
Locations for influenza transmission in the academic-creative workplace culture model displayed by mixing group. The white bars show the cumulative incidence of individuals infected in the different locations in the baseline setting. The grey bars demonstrate the corresponding cumulative incidence when the risk for influenza transmission at workplaces is decreased by 50%.

