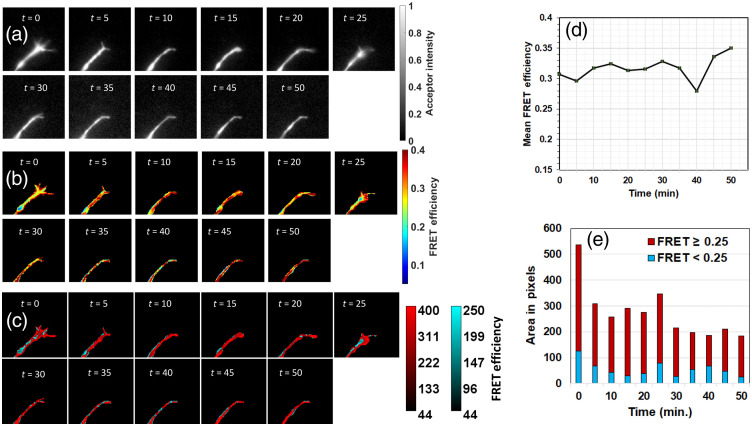
Fig. 11.
(a) Time-lapse images of background-subtracted and normalized and (b) FRET efficiency of one growth cone from a neuron expressing TSMod. (c) Pixels with FRET efficiency (red) and those with FRET efficiency (blue) are segregated to highlight the spatial differences in FRET efficiency. (d) Mean FRET efficiency of the growth cone as a function of time. (e) Area fraction of pixels with high () and low () FRET efficiency. The field of view is in each image.

