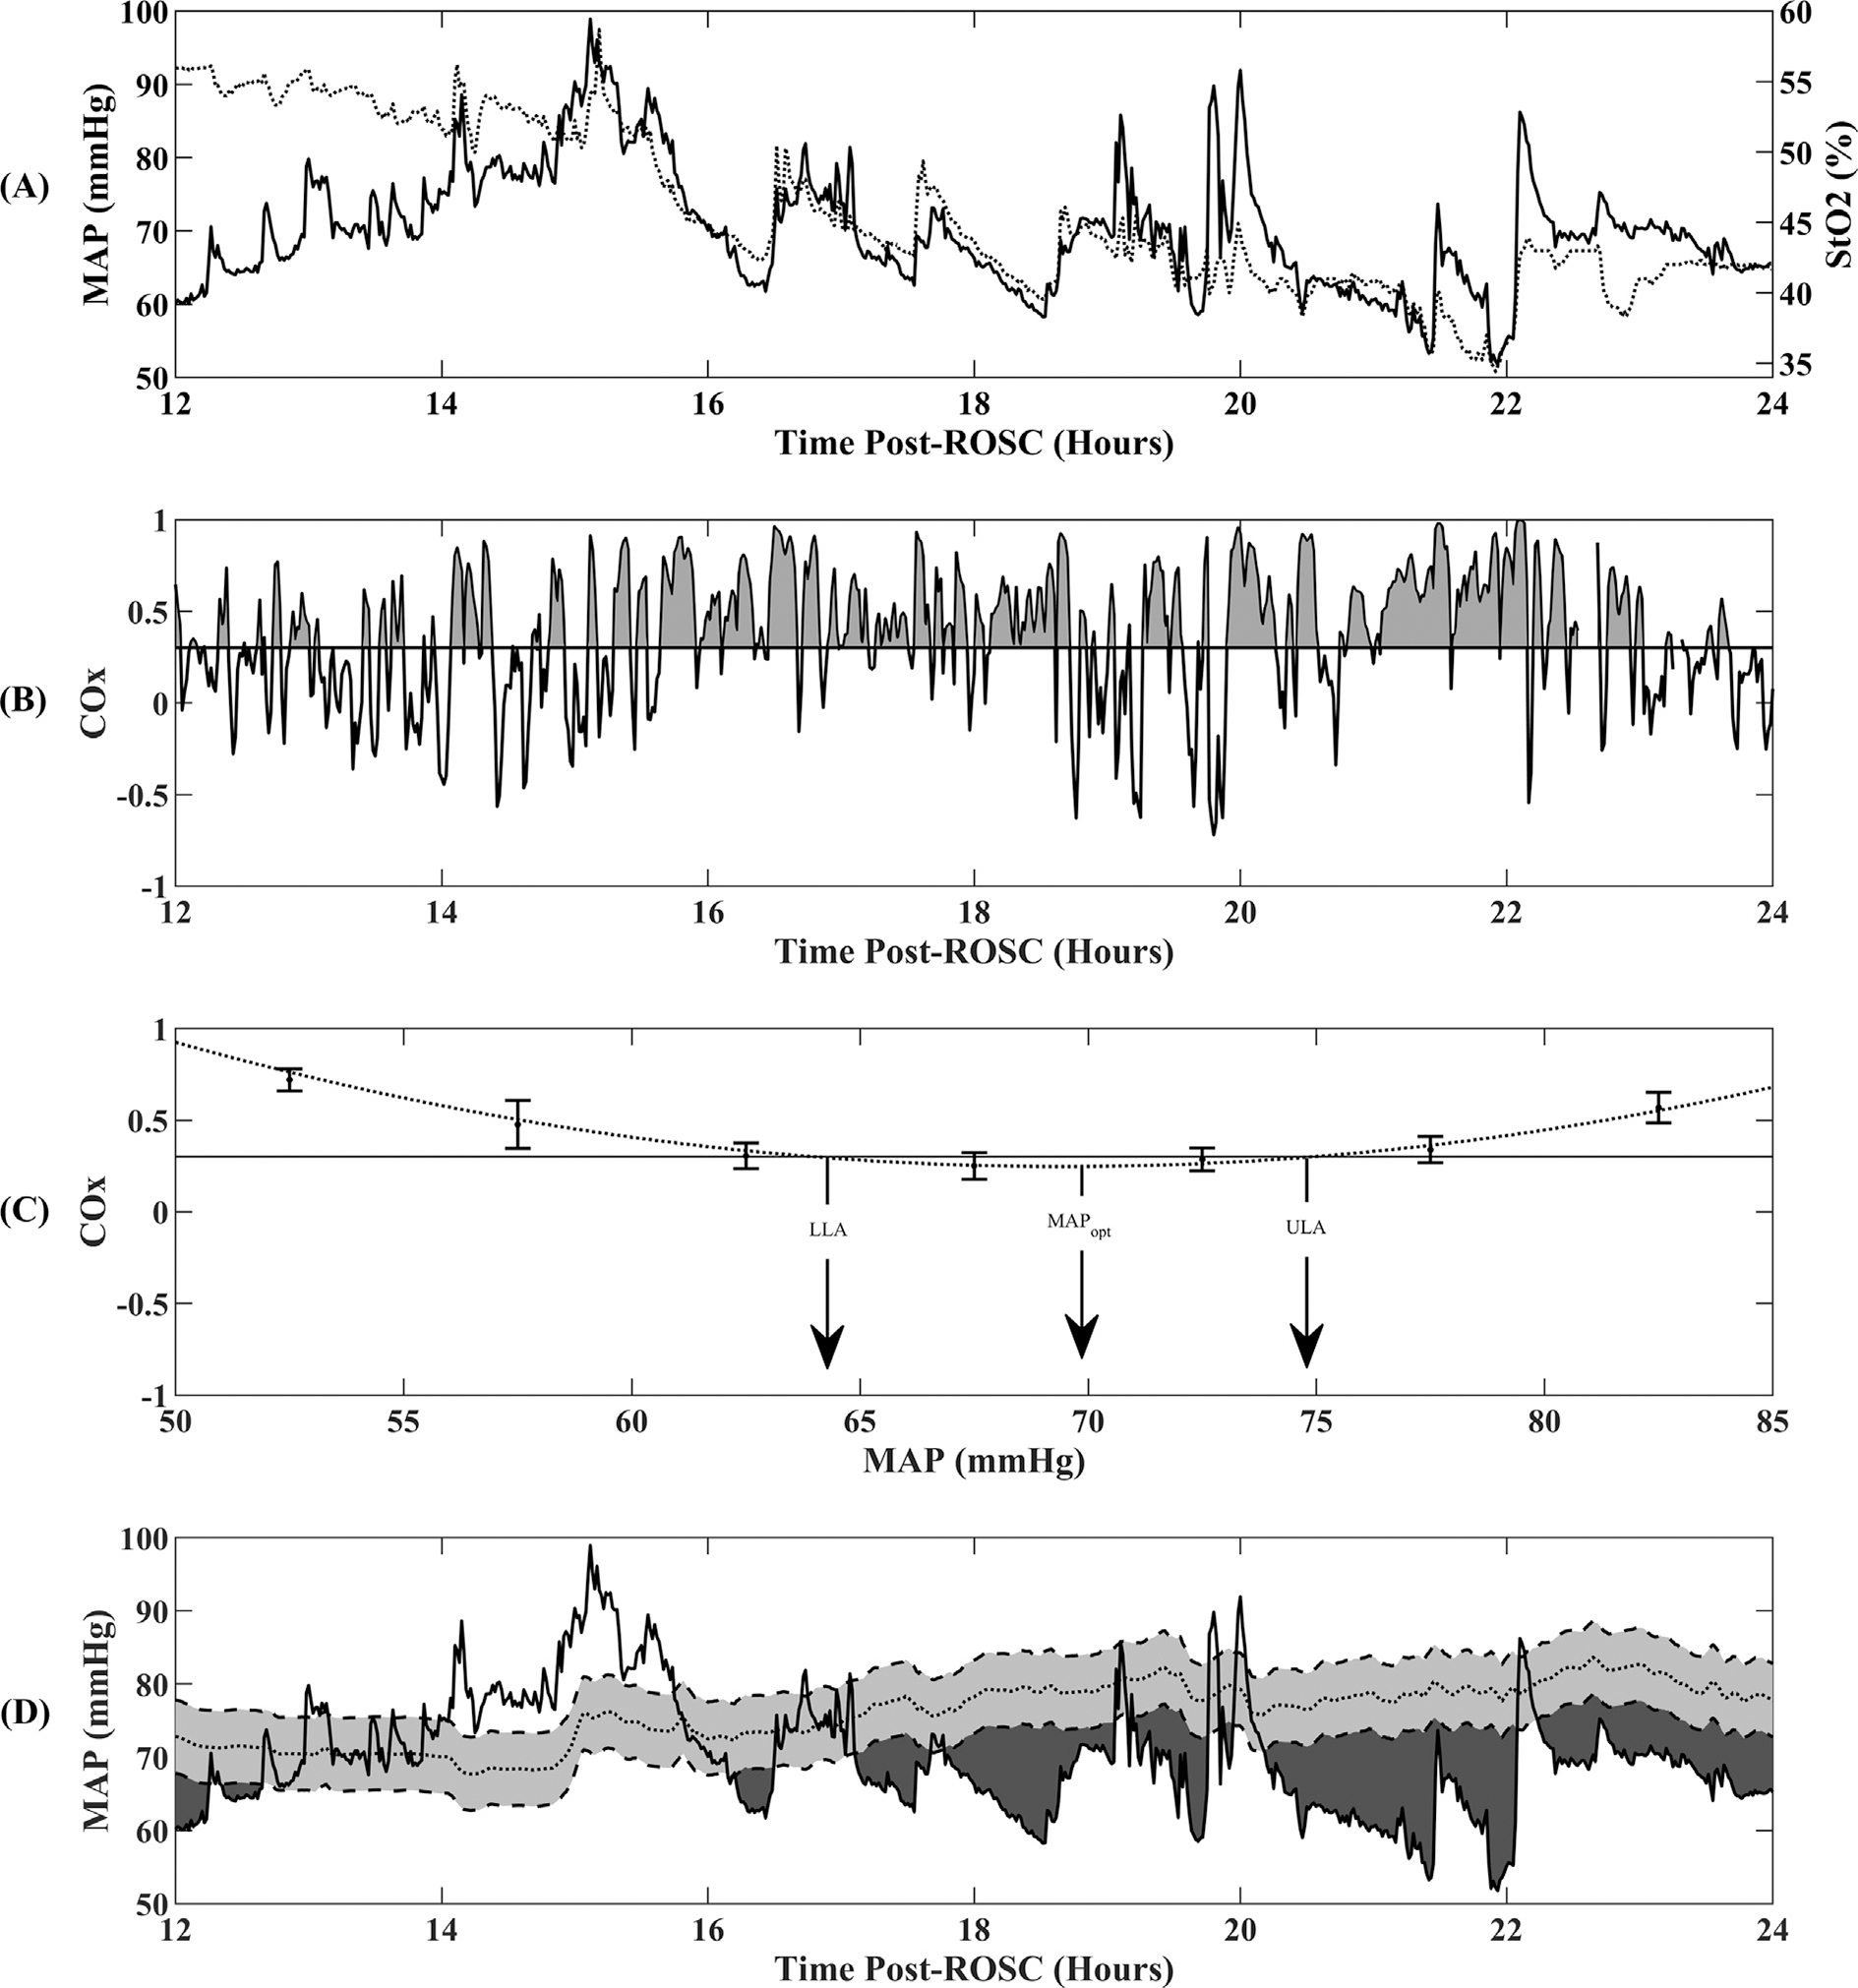
Fig. 1 –

Physiologic data over 12 h of recording from a representative patient. The four rows depict (A) mean arterial pressure (MAP, solid line) and regional cerebral tissue oximetry (StO2, dotted line) derived from NIRS; (B) cerebral oximetry index (COx), the gray shaded region on the COx curve represents the burden of impaired CAR which was defined as the area below the COx waveform and COx threshold of 0.3, and normalized as a percentage of the monitoring duration; (C) representative COx versus binned MAP parabolic curve demonstrating MAPopt at the nadir of the curve and the lower and upper limits of autoregulation (LLA and ULA) where parabolic curve crosses 0.3; and (D) MAP (solid line), MAPopt (dotted line), gray shaded region is ±5 mmHg of MAPopt, black region is burden of MAP less than MAPopt - 5.
