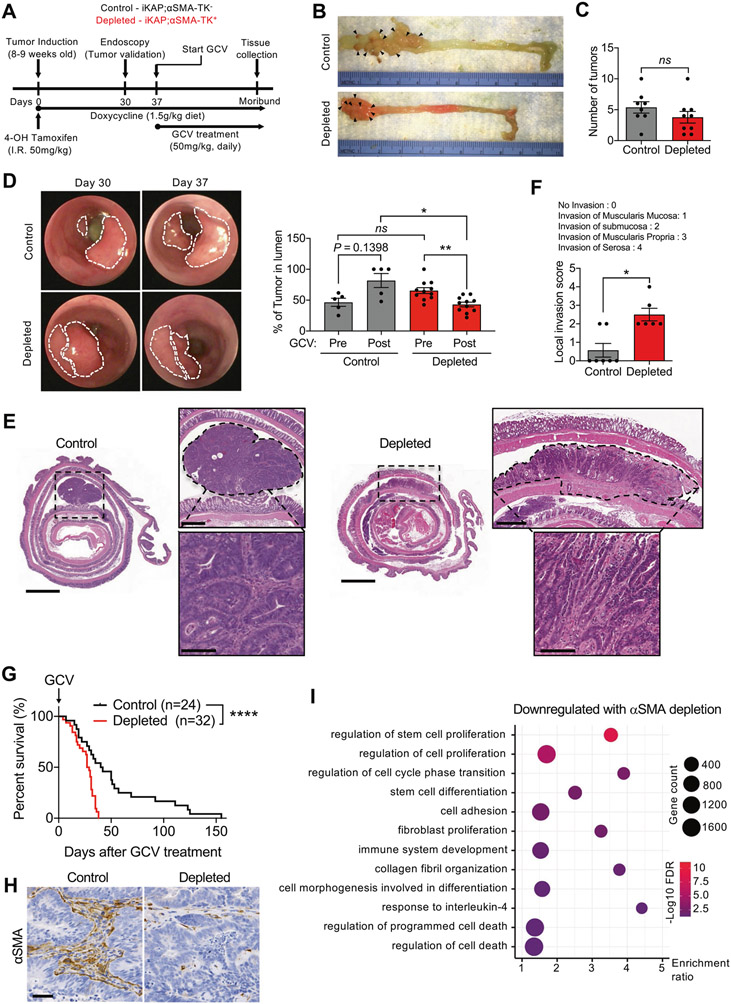
Fig. 1. Depletion of αSMA+ CAFs leads to increased tumor invasion and decreased survival in CRC model.
A Schematic diagram for tumor induction and GCV treatment in the iKAP CRC mouse model. B Images of distal colon tumors from representative αSMA+ CAF-depleted and control mice. Arrow heads point to tumor foci. C Quantification of the number of tumors in control (n = 8) and depleted (n = 9) mice at endpoint. D Representative endoscopy images of CRC tumors before and after GCV treatment, and quantification of tumor in lumen. Control, n = 5; depleted, n = 11. E Representative images of H&E-stained colon sections with tumors outlined. Scale bar for colon section: 2000 μm; scale bar for top right zoomed-in image: 500 μm; scale bar for bottom right zoomed-in image: 100 μm. F Local invasion score of tumors in control (n = 7) and depleted (n = 6) tumors. G Survival analysis of αSMA+ CAF-depleted (n = 32) and control (n = 24) mice. H Representative immunohistochemistry for αSMA in CAF-depleted (n = 5) and control (n = 4) tumors. Scale bar: 50 μm. I Dot plot of the pathways downregulated in depleted compared control tumors. The data are presented as mean ± SEM. FDR: false discovery rate; GCV: ganciclovir. C Unpaired t-test performed; D Kruskall–Wallis test with Dunn’s multiple comparison test performed; F Mann–Whitney test performed; G Log-rank Mantel–Cox test performed. *P < 0.01, **P < 0.01, ****P < 0.0001, ns: not significant.

