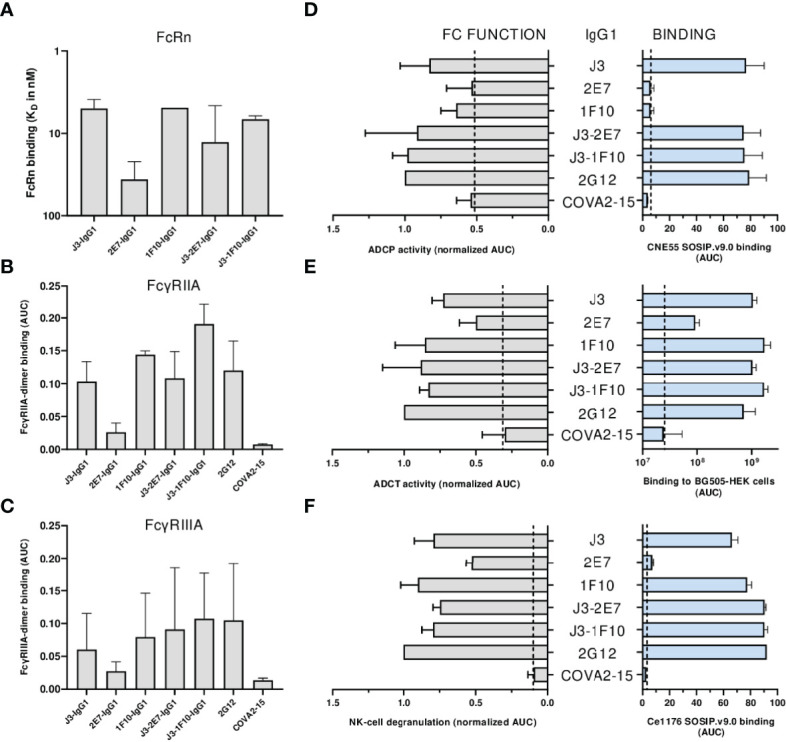
Figure 6.

Neutralization is impacted by nanobody-IgG1 fusion. (A) The KD of all nanobody-IgG1s to hFcRn, recorded at pH 6.0 using surface plasmon resonance. KD was calculated as the average KD from multiple antibody concentrations as seen in Supplementary Figure 5 . Binding of nanobody-IgG1s to (B) FcγRIIa and (C) FcγRIIIa as determined by FcgγR dimer ELISA using Ce1176 SOSIP.v9.0 as coating antigen, depicted as AUC values of the binding curves. (D) Binding of nanobody-IgG1s to CNE55 SOSIP.v9.0 as determined by ELISA and induction of ADCP using CNE55 SOSIP.v9.0 coated fluorescent beads, both depicted as AUC. (E) Binding of nanobody-IgG1s to BG505 gp160 expressing HEK-293T cells and induction of ADCT are quantified by a secondary PE-labeled anti-IgG antibody and uptake of membrane fragments by THP-1 cells using flow cytometry, both depicted as AUC. (F) The binding strength for all nanobody-IgG1s to Ce1176 SOSIP.v9.0 as determined by ELISA and subsequent activation of NK-cells plotted as the percentage of CD107+ NK-cells. 2G12-IgG1, specific for HIV-1 gp120, was used as a positive control and COVA2-15, specific for SARS-CoV-2, was used as a negative control. The dotted lines represent the background level that is observed in these assays in the absence of antibody. Effector function data is normalized to the positive control, 2G12. Data shown are the average of at least two independent experiments.
