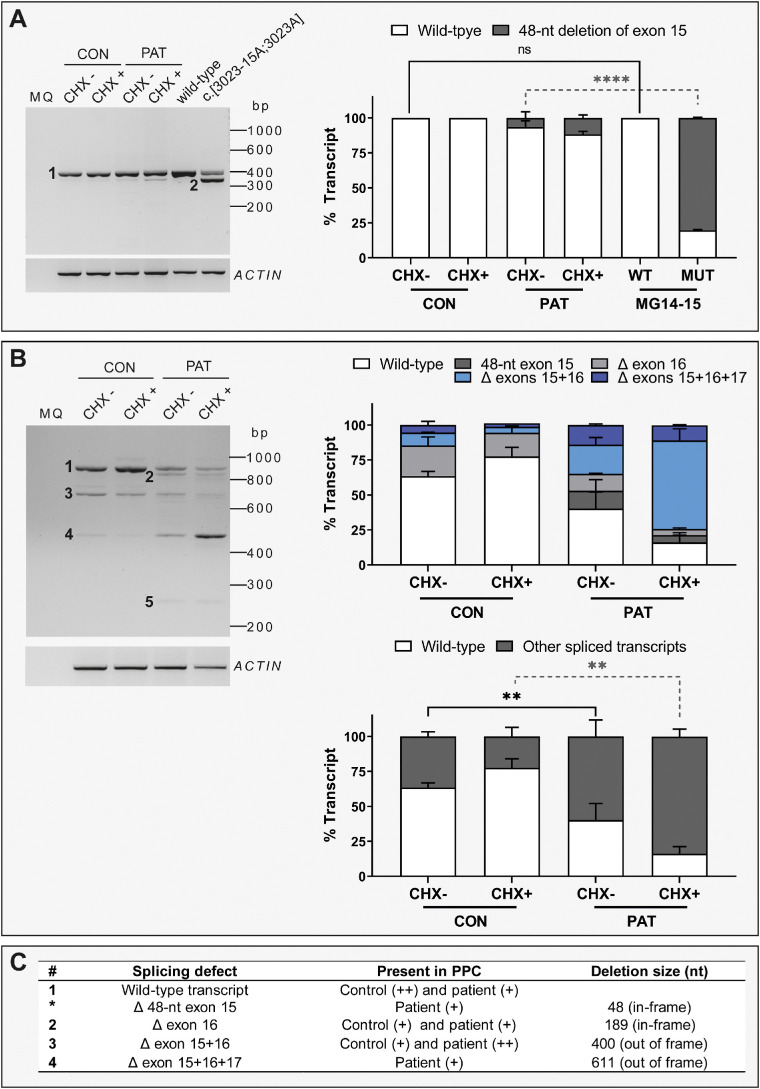
Figure 4.
IMPG2 transcript analysis in PPCs. (A) Analysis of transcripts amplified from exon 14 to exon 15 between control- (CON) and patient (PAT)-derived PPCs and two MG constructs: WT and c.[3023-15T>A;3023G>A] (MUT). The left panel shows a representative RT-PCR gel picture. The bar chart on the right represents the semiquantification of the percentage of each transcript as mean ± standard deviation. The PPC lines were evaluated with cycloheximide treatment (CHX+) and without cycloheximide treatment (CHX–). The experiment was performed in duplicate. For the statistical analysis, CON CHX– was compared with MG14-15 WT and PAT CHX– was compared with MG14-15 MUT using a one-way ANOVA test. Statistical significance is indicated as **** P < 0.0001 using one-way ANOVA test. (B) Analysis of transcripts amplified from exon 14 to exon 18 between CON and PAT PPCs. The left panel shows a representative RT-PCR gel. The right upper panel represents the semiquantification of the percentage of each identified transcript as mean ± standard deviation. The right lower panel represents the percentage of full-length transcript (WT) and the sum of all spliced transcripts. The PPC lines were evaluated with cycloheximide treatment (CHX+) and without cycloheximide treatment (CHX–). The experiment was performed in duplicate. Statistical analysis was performed by comparing CON and PAT CHX-untreated conditions and CON and PAT CHX-treated conditions. Statistical significance is indicated as ** P < 0.01 using one-way ANOVA test. For the final RNA and protein annotation, only the fragments with >10% of total RNA were included. (C) Summary of the different transcripts detected in (A) and (B). The number of each transcript is indicated on the left side of the referred the band. (+) indicates weak expression and (++) indicates high expression. bp, base pair.

