Figure 2.

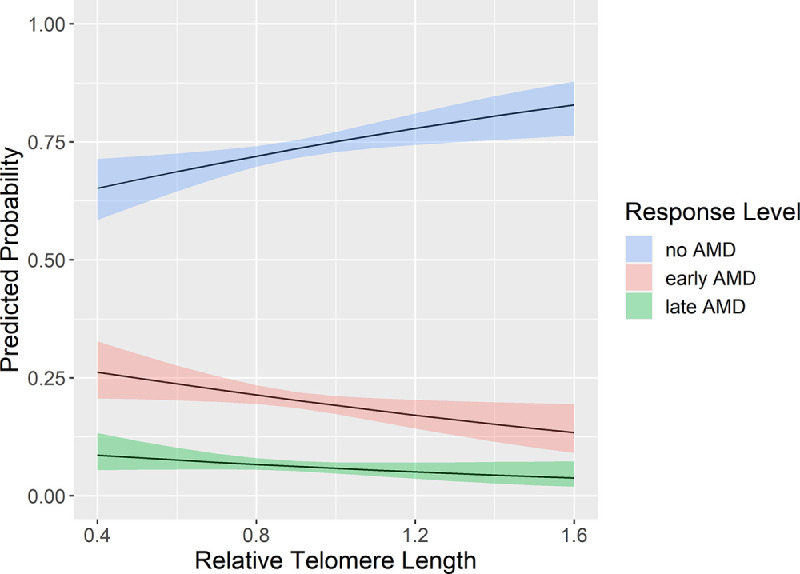
Effect plot depicting the predicted probability (with 95% CIs; y-axis) of having no AMD (n = 1635), early AMD (n = 455), or late AMD (n = 172), given a specific relative RTL (x-axis), adjusted for age and sex.

Effect plot depicting the predicted probability (with 95% CIs; y-axis) of having no AMD (n = 1635), early AMD (n = 455), or late AMD (n = 172), given a specific relative RTL (x-axis), adjusted for age and sex.