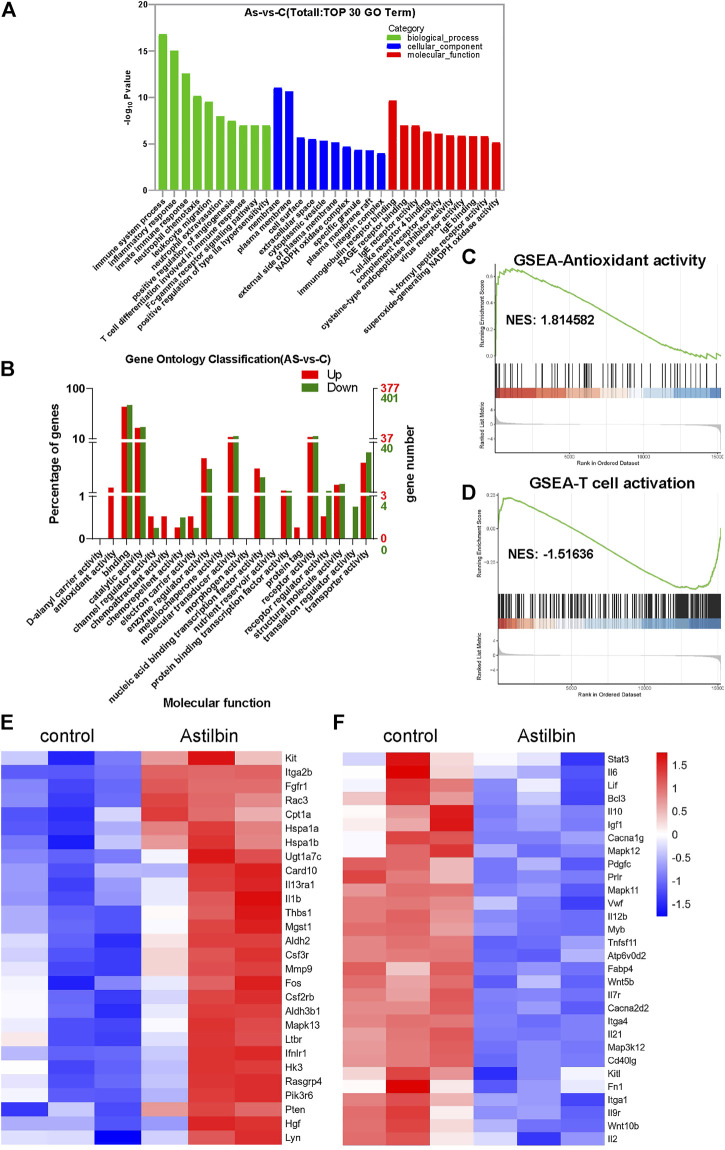
FIGURE 5.
Transcriptome analysis of astilbin-treated CD4+ T cell functions. (A) Top 10 changed genes in biological process, cellular component, and molecular function. (B) Numbers of differentially expressed genes in molecular function by gene ontology analysis. GSEA of signaling molecules involved in antioxidant activity (C) and T cell activation (D). Heatmap of upregulated (E) or downregulated (F) genes involved in immune function.

