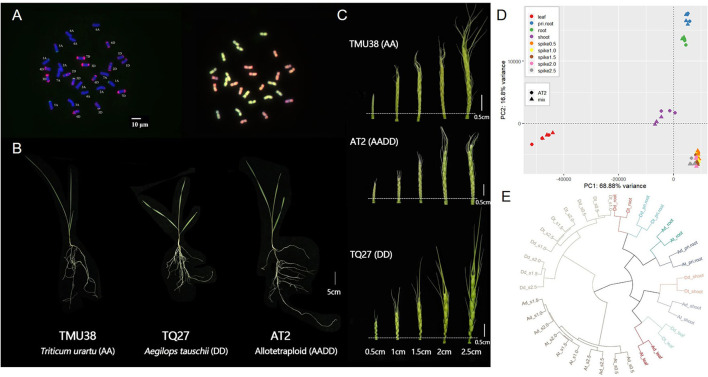
Figure 1.
Karyotypes, phenotypes, and spatio-temporal gene expression clustering in synthetic allotetraploid wheat (AT2, AADD) and corresponding parental species (TMU38 and TQ27 for AA and DD, respectively). (A) Euploid karyotypes of AT2 detected using fluorescent in situ hybridization (FISH, left) and genomic in situ hybridization (GISH, right). The DNA probes of FISH analysis are pSc119.2 (green) and pAS1 (red); (B) The phenotype of trefoil stage seedling of AT2 and parent species; (C) The spike morphology of AT2 and parental diploids from 0.5 to 2.5 cm in length; (D) Principal component analysis (PCA) of transcriptomic expression profiles in AT2 and parental diploids (represented by “Mix”; see Materials and Methods). Colors and shapes denote the different tissues/stages and genotypes, respectively; (E) Hierarchical clustering of homoeolog expression in AT2 and parents. Ad and Dd denote the ortholog pairs in AA and DD diploid parents; At and Dt denote the homoeolog pairs in AT2. The bar of karyotype and phenotype photos is shown as white lines.

