Figure 2.
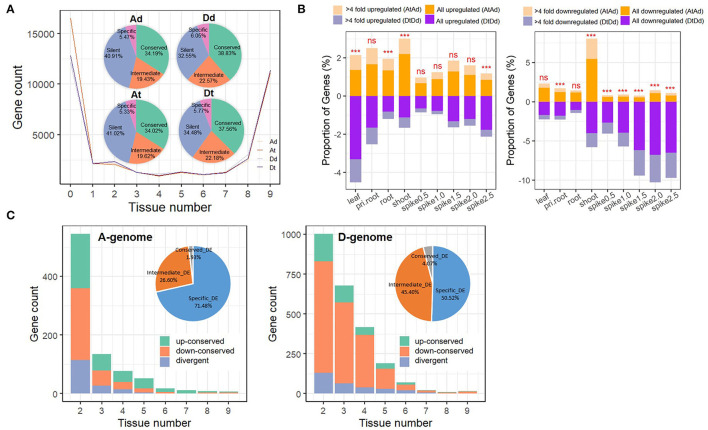
Asymmetric expression response of subgenomes to allopolyploidy in AT2. (A) Gene expression patterns among nine tissues/stages in AT2 and parents. Gene expression distributions of different tissues/stages among genomes/subgenomes are shown in the line chart. The numbers of genes that marked as “silent” (without expression in any tissue; 0 tissue), “specific” (TPM > 1 in one tissue), “intermediate” (TPM > 1 in 2–7 tissues) and “conserved” (TPM > 1 in 8–9 tissues) among genomes/subgenomes are specified in the pie chart; (B) The proportion of up/downregulated genes (At vs. Ad and Dt vs.Dd) in different tissues/stages. Respective statistical significance of difference in the number of DEGs between A and D subgenomes is specified above each column (***denotes significance at p-value < 0.001; ns denotes “no significance”); (C) Conservation of DEGs among tissues/stages in A (the left panel) and D (the right panel) subgenomes. The number of three gene groups genes, including “up-conserved” (genes in all given tissue numbers are upregulated, green color) and “down-conserved” (genes in all given tissue numbers are downregulated, orange color) and “divergent” (genes in some tissues are downregulated but upregulated in other tissues, blue color) groups, are shown in barplot. DEGs occurred in only one tissue (specific_DE, blue color), 2–7 tissues (intermediate_DE, orange color) and 8–9 tissues (conserved_DE, gray color) are presented in the pie chart.

