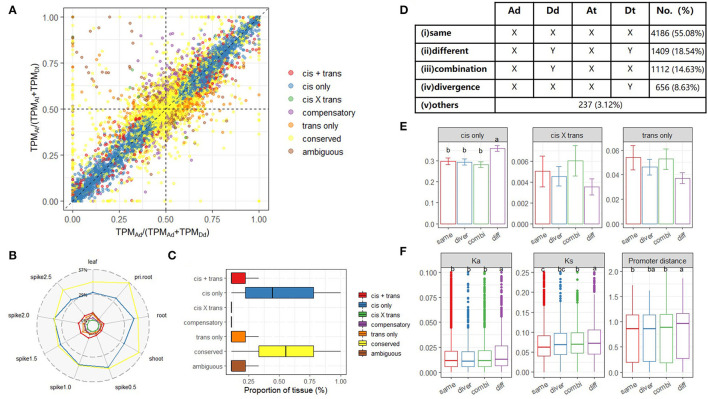
Figure 4.
Homoeolog-specific expression (HSE) analysis across tissues/stages. (A) A scatterplot shows the relationship between the expression ratio of A allele at a diploid level [x-axis, TPMAd/(TPMAd+TPMDd)] and that of A homoeolog at a tetraploid level [y-axis, TPMAt/(TPMAt+TPMDt)] for genes in root tissue. The colors represent different HSE patterns determined for each gene; (B) Proportion of homoeolog pairs classified into each HSEpattern; (C) The conservation degree of different HSE patterns among tissues; (D) The number of homoeolog pairs among five co-expression groups of quadruplets (orthologs Ad and Dd as well as homoeologs At and Dt) in AT2 based on the co-expression network. For a given module, “X” means a gene is belonged to this module, whereas “Y” means a gene is not in such a module; (E) The proportion of different types of HSE genes in four co-expression groups. Error bars indicate the variance among nine tissues. One-way ANOVA and multiple comparisons were performed to compare the ratio among co-expression groups (p-value < 0.05); (F) Evolutionary features of homoeologs belonged to different co-expression groups are denoted in each sub-panel, including Ka (non-synonymous mutation), Ks (synonymous mutation), and sequence divergence of the promoter region. One-way ANOVA is used to compare the difference in each evolution feature among co-expression groups (p-value < 0.05).

